
Making Life Easy with Incremental Analysis and Change Tracking
In this article Adithya Ramamurthy and Gianfranco Ruggiero join an interview to talk about AutoForm’s special feature ‘Automatic Issue Detection.’ Unique to AutoForm, we wanted to find out how this feature makes life easier for the user and reveal how it inspects a part or sheet for issues during process design.
“One of the most important and time-consuming step of the sheet metal forming process design is the so called “post processing” of the simulation results. – With this term we generically indicate the thorough research of any kind of defects or risk of defects in the “virtually” stamped panel that might occur also in the real panel. This analysis essentially consists in checking the values of different results, or combination of them, and the relative comparison with acceptable limits (range). We at AutoForm tried to make this analysis not only as accurate as possible but also as quick and comprehensive as possible” Gianfranco Ruggiero, PM at AutoForm, introduced.
Gianfranco continues:” all variables result is calculated per each element of the mesh the sheet is divided into (finite element principle), meaning that there are thousands of values that must be checked and evaluated. As common practice, to simplify this check and make it “as visible” and direct as possible, a color scale is set. A color is defined in a given range of values (thresholds) and any single element is colored accordingly; the higher the number of ranges and the more “continuous” the map will be. To get to know the exact value of the variable in a certain point (mesh element) the user can simply click on it and a label with the calculated value appears on the screen“.
The image below shows the result variable called „max Failure“ in AutoForm on the sheet right after the drawing operation. The color scale that has been adopted in this case is shown on the right-side of the image.
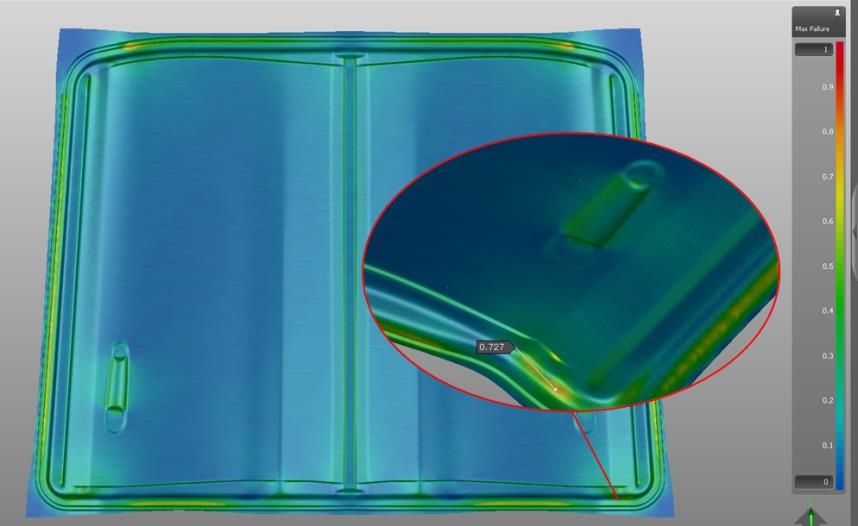
Figure 1 – Max Failure result on a drawn sheet (click to enlarge).
Color scale and limits can also be specified through the application of “Standards” that might be imposed either from customers or internally (check this link to get to know more about application of “Standards” within AutoForm solution).
“Users have to accurately check the entire sheet and locate the critical areas; proper countermeasures will be evaluated according to the findings. If we think about running such accurate and detailed analysis for all results variables for each simulation of the tool design process, it is easy to understand how much time is actually required and spent to accomplish this task. Thinking about the numerous simulations that needs to be ran and the numerous checks performed at the end of each one of them before reaching a feasible process, we definitely understand how the colored map is not enough for a complete and continuous monitoring of the project/process”.
„With the aim of helping our users to better and quicker accomplish this task“ Adithya Ramamurthy, Application Engineer from AutoForm USA says “in AutoForm we defined the concept of “issue”. Two different typologies of issues can automatically be detected by software. The first type is based on the comparison of the calculated numerical value of a certain result variable in one point (or area) and the acceptable limit (or range). Wherever in panel the calculated value exceeds the limitations (outside the range) an issue is detected. The second type of issue is instead based on the determination of the movement of the material and the comparison with limit curves. In few words the user defines a curve that represents a limit for the material movement and wherever this condition is not met an issue is detected”.
Let’s make a small example to better explain these two concepts.
Just to give an idea of the functionality of the software in defining the first type of issue, we would like to detect the risk of splits in a panel. To do that the user can define limits on two different result variables: we can “tell” the software that the split issue must be searched wherever the “Max Failure” variable exceeds 0.7 or wherever the “Thinning” is higher than 25% of the nominal sheet thickness (the calculated thickness is lower than the 25% of the nominal value). Two levels of severity can be defined: in this case we can define a lower severity (highlighted with the yellow color) if max failure value exceeds 0.7 but is lower than 1.0, and high severity (red) when max failure exceeds 1.0.
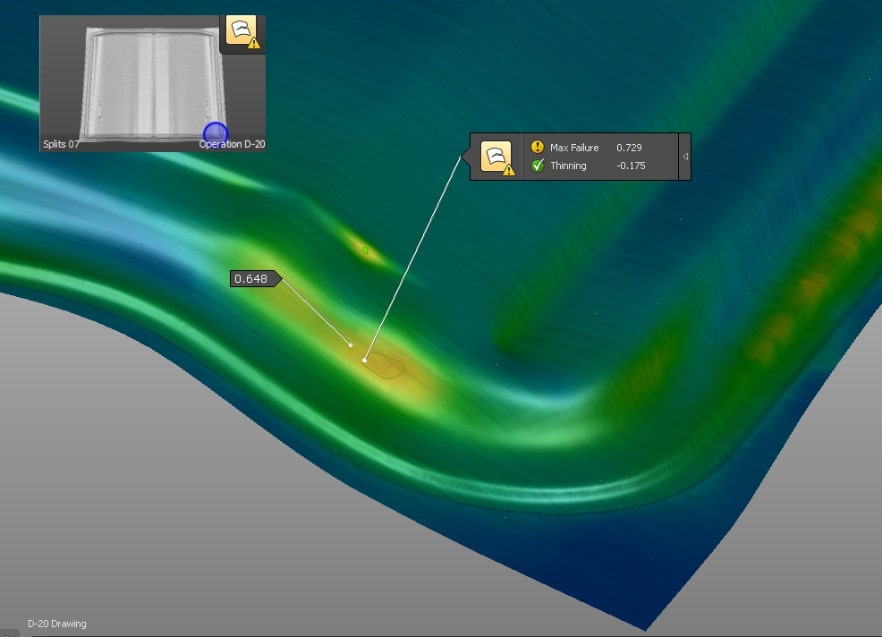
Figure 2 – Example of split issue detection (click to enlarge).
The picture above shows one of the issues automatically detected by the software. As you can see, the software grouped the elements defining an area (closed curve) where the calculated max failure (0.729) exceeded the limit (0.7); in this example the value of the Thinning (17.5%) is below the maximum allowed limit (25%).
Note that the adjacent area, even yellow colored, is outside the detected area because the values are lower than the max limit.
The user has the possibility also to modify the issue spot to include/exclude adjacent areas: the software implements an easy-to-use curve editor. The image below shows the final shape of the the previous automatically detected issue.
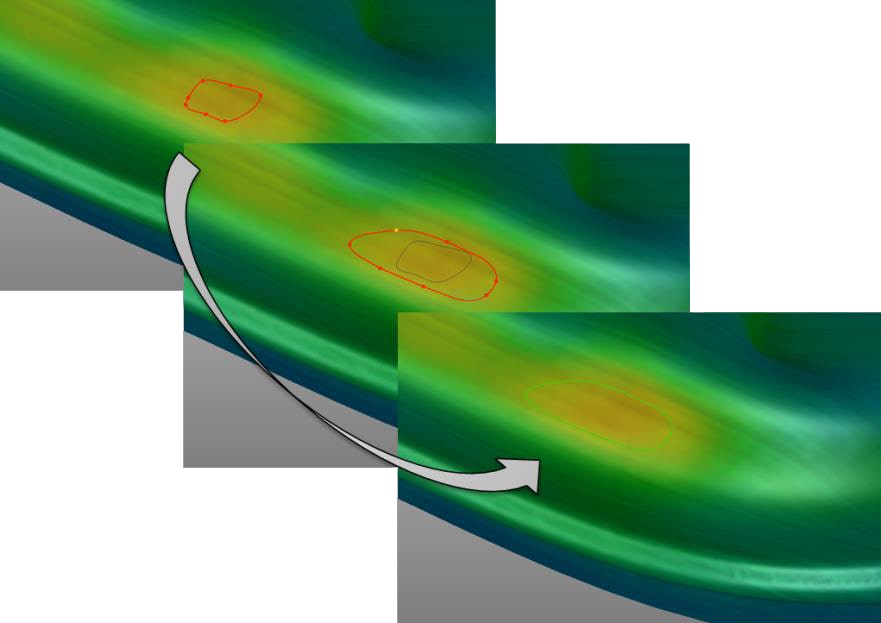
Figure 3 – Manual modification of an area with split issue
Let’s see now the automatic detection of issues related to excessive material movement.
For example, we would like to avoid that the edge of the sheet slides in the drawbead section during the drawing operation.
Rather than visually checking this result along the edge of the panel, it is possible to design the curve that represents this limit and let the software detect whether the edge of the stamped sheet crosses this curve or not.
The image below shows an example of this type of issue definition.
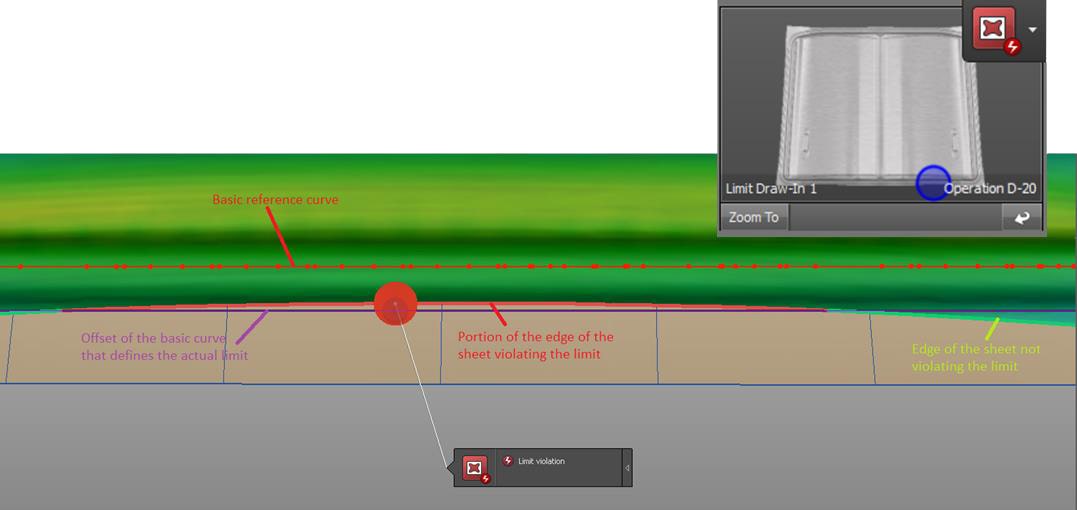
Figure 4 – Draw-in issue automatic detection (click to enlarge).
To define the limit curve in this case we did not input the curve from scratch but we used the offset curve of the drawbead center line. The software automatically detected which portion of the sheet edge violated that limit (highlighted in red) and which did not (highlighted in green).
Adithya stated: “as already mentioned, the list of either manual or automatic detected issues is saved in the project file so that the user can track their status (fixed or not) after each simulation. It is also possible to add new issues (same or different type like wrinkles etc..) as they occur in new simulations while all fixed issues can be removed, it is up to the user”.
Gianfranco concludes: “The role played by the “issues” becomes even more important when multiple simulations (realization) have been run at once because in that case the software is even able to look for countermeasures (different input value) among the process parameters that have been set as variable in this type of calculation. But this is another aspect of the high potentials of AutoForm solutions that goes beyond the topic we wanted to cover here and it deserves to be explored separately and in deeper and more complete manner”.
New readers, don’t forget to sign up to our blog! You’ll get zero marketing emails, just monthly blog updates on top post!
Thanks to all of you who have already subscribed!


