The Complexities of Calculating Temperature Distribution Brought to Life – an Interview with Michael Düring AutoForm
[dropcap]J[/dropcap]oining us today Michael Düring, Product Manager at AutoForm Germany offered insights into what was really behind the development of an effective simulation method for forming and quenching in hotforming at AutoForm, sharing its fascinating complexities.
As hotforming grew in popularity one of the biggest requests was the implementation of cooling channels in simulation. The challenge was to provide stronger options to represent temperature distribution on tool surfaces. At that time AutoForm only had mapping options so there was room for developing accurate computations, in a separate FEA tool, which could properly predict distribution during the thermal cycling of the part during hot stamping.
More specifically, customers required a solution that would have an effective representation of the real conditions of the surface of the tools as they come into contact with the blank. The goal was to have even more predictability through simulation, offering an accurate feasibility representation of both the forming and quenching process.
AutoForm delivered with its update in releasing R7, launched in Q1 2017, with the desired functionalities that made customers independent from 3rd party solutions for the prediction of temperature fields on the contact surfaces – which is mainly linked to the necessity of detecting hot spots and the thermally cyclic behavior of the entire forming system.
Prior to this, OEMs were left with only a few options. One avenue taken was to set a homogenous temperature at the tool. This was the root of the customers’ pains. The problem was that once the blank is clamped between the tool (upper and lower dies) the temperature in reality is inhomogeneously distributed on the tool surface. Not to mention the fact that local cooling of the part is dependent on the pressure applied between the tool itself and the sheet. Now and in addition, different heat transfer coefficients can be applied sufficiently representing specific flow conditions in the cooling channels, and being translated to different surface temperatures.

Figure 1: Typical Cooling Channel Design
The Complexities of Simulating the Hot Stamping Process
‘There are several factors which come into play, namely the material, the heat capacity and then the heat conductivity of the material’ says Michael, adding ‘here the material properties of the blank face the process conditions, whereby the blank comes into contact with the tool surface. In doing so the tool surface now meets the temperature of the blank surface itself. To add another layer, when these two meet it is through the application of pressure (under stamping and quenching) and depending on how much pressure is applied you arrive to a different heat transfer coefficient.’
‘Naturally, more pressure applied coupled with a higher temperature difference in a certain spot, results in the heat transfer values becoming higher. When there is a small gap, slight contact to the tool itself or the temperature delta is smaller then the heat transfer is lower. This needs to be considered across the entire blank surface. Parallel to that a calculation must be made like this across the entire tool surface.’
Michael Duering offered an example, ‘Let’s say you have a sequence of 4,000 parts to be stamped. At first you have your initial conditions for calculation, where you immediately start with a base temperature of the cooling medium. The entire tool is cool at first, but the impact of the cooling channels is quite high. If the surrounding temperature, resulting for example from water temperatures and cooling channels at say 14 degrees, and the surrounding area is let us say 21 degrees, then the connection between the tool surfaces and the surrounding area – represented by convection and radiation – is going to be comparably low. Thus you can assume you have a temperature of 14 degrees distributed all over the contact surfaces of the tool itself. This is your starting point.’
‘Now you ramp up’ says Michael, ‘As you start producing the first parts they become hot. During contact they are at a high temperature but in the process they are suddenly cooled down. As it cools down, say from 750 degrees after all transfer and positioning all the way down to around 100 degrees, as at this moment it is taken out of the tool, consider that at this moment this energy has been transferred into the tools. At the same time you have the cooling media circulating, creating an interplay which must be simulated to create better observation.’
‘Then it all starts to merge together. The surface of the tool has increased due to the energy being introduced into the tool and this further increases the temperature in the interface between the cooling media and the outer area of the cooling channels. What we have effectively done is simulate the increase of this temperature during ramp up till a thermal equilibrium is reached.’

Figure 2: The Tool Surface Temperature during Ramp Up
Michael explained the diagram, saying ‘This is a process viewed over the forming of several parts. Every peak is one part reaching its highest temperature – which is relevant for wear prediction for the entire lifecycle of the tools made of a distinct material. It shows the surface heat of the tool. Due to the thermal inertia, within the tool material itself, these peaks are ‘softened’ so to speak, creating a range to control the heat, within which production may be run. The diagram shows the heat transfer at the interface, between the cooling media and the tool material itself. And as well here: The bigger the difference is, between the surrounding tool material and the water inside the cooling channel, the greater the heat transfer becomes. These are two effects. But, bear in mind the diagram only considers ‘one spot’ on the tool surface. In reality all ‘spots’ are simulated this way, across the entire surface, creating a more complex picture.’

Figure 3: Temperature Distribution on a Punch Surface after Quenching
As complex as all of this sounds there is a reason why, ultimately the heat distribution needs to be represented. Phase transformation is happening inside the blank, the key is to control it, seeing that the higher the cooling rate – the harder the material can become. What part makers wish to achieve is to control the hardness of the material.
Michael clarified saying, ‘Imagine you have variations of higher and lower temperature over a tool surface. Suddenly you introduce your blank sheet metal which is then heated, and even then the blank already has its own temperature variations, and once introduced into the forming tool there are even different temperatures being introduced in different spots. The energy removed from the blank will be different on one side than the other and it means that, as a result, you’ll have a certain cooling rate induced across the sheet metal part once it’s stamped.’
He continued, ‘Now imagine you have one spot where your cooling is not perfect. If you do not represent the cooling channels properly you will not find the spot where the phase transformation is not desirable, and this in turn might lead to a soft spot in your final part, which in turn affects the safety of the part. You have to control it. In order to control it you need to know the temperature distribution on the part. A part maker is obliged to deliver and to document first class quality. Those soft spots would show up during a crash, as those are the exact points where, during a collision, the part is going to crumble upon impact. Therefore the producer needs to leave nothing unknown. They need to be sure that no such inconsistencies occur within the properties of the part itself. Otherwise yes, during a crash this would be dangerous and nothing must be left to guessing or unpredictability.’
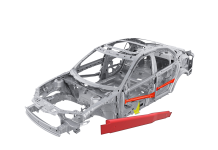
‘Another example’ says Michael ‘is the B-Pillar which you can imagine how it would protect passengers also during a side-on impact. It has to be resistant. Otherwise the entire structure would be compromised during a side-on collision. You also have beams implemented in the door, made from this material. The whole science started with distinct crash relevant parts, but nowadays you also use it for the A-pillar, floor, fire wall etc. which are made through hot stamping. Such a hot-stamped part can reach a yield-strength of above 1,100 MPa, and ultimate tensile strengths of far more than 1,500 MPa. With hotformed AHSS steels you are above 450 MPa, ranging to 1000 MPa referring to higher ductility due to a significantly lower carbon content.[1], [2] This is where you can see the wide range of application for safety and strength. Furthermore, cold formed high performance steel grades offer limited formability, translating into smaller degrees of freedom for part designers. The section modulus of the part segments strongly depends on the “(draw) depth” which affects the efficiency of the entire concept of unibody design – the Young`s Modulus stays nearly the same for all steel materials.’
‘You can achieve superior properties for your materials whilst integrally implementing more complex designs when they are processed this way. You can also explore opportunities to save further weight on the vehicle. When you have a strong and more energy absorbing material naturally you can use less – still standing the worst cases for crash. This is why simulating hot forming and the cooling channels have become so important.’
Thank you Michael from all our readers for this informative post.
Everyone: see more as we continue this interview in Part 2: ‘Do you really need to compute the flow conditions inside the cooling channels?’ where Michael tackles a controversial topic regarding hotforming-simulation in the sheet metal forming industry.
Don’t forget to sign up to follow our stories. You’ll never get marketing emails, only a highlight of our blog post updates once per month.
[1] https://automotivemanufacturingsolutions.com/process-materials/manufacturing-with-uhss
[2] http://automotive.arcelormittal.com/saturnus/sheets/E_EN.pdf


