In this article, we explore how specific strategies improved the development of automotive parts at an anonymous OEM in China, highlighting the positive impact of simulation on their stamping process.
But before we dive into that, here is a quick timeline overview of stamping simulation at the OEM:
- 2005: Passenger vehicle production began, and until 2016, the company relied on traditional springback compensation methods. As expected, these methods required extensive manual adjustments to compensate for springback, wrinkling, and splitting.
- 2016: The company sought to improve stamping efficiency by adopting new strategies. They began verifying the process using AutoForm and introduced process optimization, debugging optimization, and coordinate transformation.
- 2019:
In 2019 they introduced robustness analysis of the process and the complete tribology description of the friction coefficient in place of constant values
- 2020: The OEM fully implemented robustness analysis and formally introduced TriboForm. They required part fitting to punch for all operations in the simulation and started collaborating with the TriboForm team to build a customized library. The OEM provided materials and oil for the operations, allowing TriboForm to incorporate factors like material surface roughness into the library.
- 2021: The OEM received its first customized TriboForm material library and was prepared for the executive component design of an automatic draw-in control system.
- 2022: They started developing a second material library for TriboForm and applied the Delphi method, which involves expert consultation, to further optimize their process.
- 2023: Innovation was promoted by implementing the small inflow strategy for more complex part designs. They also developed automatic control for the draw-in process during production.
The OEM’s Findings
Before using robustness analysis, engineers had to conduct multiple tryout loops for die adjustment or remill the die face in production, as the deviation between simulation and reality was too high. Additionally, the absence of their own TriboForm library led to inaccurate results, requiring manual adjustments. These adjustments were time-consuming and costly, as they were often carried out through trial and error, necessitating several die recuts or remills per part.
By simulating in-house steel parts, the OEM reduced the remilling time of the drawing operation before die launching from one to four times per part to just 1.1 times per part. For critical aluminum parts, the average remilling frequency is now around 1.19 times per part.
The dimensional requirement was ±0.5 mm for general areas and ±0.25 mm for specific areas. They successfully met these dimensional standards with fewer tryout loops and in less time.
What Is the Smart Die Draw-In Process?
The OEM introduced a new material flow process for complex part designs called the Smart Die Automatic Material Flow system.
They began by using the minimum draw-in process for parts where lock beads could be applied. While this worked for most parts, some instances required a more advanced solution as lock beads couldn’t be used, and the Cp values exceeded permissible limits. For such cases, they employed the Smart Die automatic draw-in control process, which provided optimized automatic control for the draw-in.
Part in Focus
Let’s look at a specific case where the OEM improved the stamping process. The part in question is a hood from a newer model that was experiencing production issues. Two main factors contributed to these problems.
First, the material springback did not match the simulation due to the lack of a dedicated material library. Second, robustness analysis had not yet been implemented, as these events took place before the introduction of robustness analysisj from AutoForm-Sigma. As a result, the team relied on manual adjustments to meet dimension requirements.
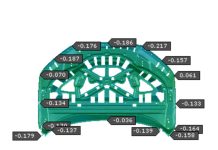
For this hood part, simulation was utilized to verify the manipulation of the flanging tool’s entry to determine the best entry point. Tests on the front area of the hood revealed that specific adjustments could improve the situation. The team optimized the flanging tool’s conversion point position and entry timing to minimize springback. These changes eliminated the need for recuts or welding. The following image visually demonstrates the effect of these changes.

Figure 1: Free springback and real measurement results with optimized flanging tool geometry. (Note, some areas have been blurred to remove design features).
As seen in the results, the best flanging tool geometry was identified, significantly reducing springback.
Benefits of the Smart Die Draw-In Process
The following bar graphs illustrate the improvements in various aspects of the simulation process after implementing robustness analysis and the Smart Die draw-in process.

Figure 2: The effect of simulation integration on various stamping process parameters. Left to right: 1) First panel dimension deviation; 2) First panel pass rate; 3) Number of surface reactivation attempts before yellow release; 4) Home line debugging time
In each graph, the blue bar represents the values before robustness analysis implementation, while the green bar represents the values after implementation.
The first bar graph shows a reduction in first article size deviation after AutoForm implementation, from 6 mm to 2.37 mm.
The second graph illustrates the improvement in the first article pass rate, from 41.80% to 73.50%.
The third bar graph shows the number of surface rectification attempts required before the yellow bus release. No surface rectifications through remilling or recutting were needed after implementing the Smart Die process, reducing the number of tryout loops from four to zero, demonstrating an incredible advantage.
Finally, the fourth bar graph showcases a sharp reduction in debugging time, dropping from 78 hours to just 5.9 hours. Together, these improvements highlight the potential of AutoForm implementation and the new process to improve stamping operations.
Summary

Figure 3: Project statistics for steel parts. White dot: The average first-piece size pass rate is 73%; Blue dot: The average delivery pass rate is 87%; Black dot: The average number of surface recuts before shipment is 0.11 times

Figure 4: Project statistics for aluminum parts. White dot: First article size pass rate and average pass is 62%; Blue dot: The average delivery pass rate is 86%; Red dot: The average number of pattern reductions before shipment is 1.19
The OEM experienced significant benefits from incorporating simulation into their stamping process. About 60% of their dies now require no recuts. The project involved 18 steel parts for one model and 16 aluminum parts for another. The top and bottom graphs show the performance statistics for steel and aluminum parts, respectively.
As we can see, among the 18 steel parts, only one (the front door outer panel on the left) required two recuts. The remaining 17 parts needed no recuts and were ready for shipment immediately.
For the 16 aluminum parts, most required only one recut. Some needed two recuts, some zero, and only one part required three recuts.
The results demonstrate that using simulation to validate and improve stamping processes is highly effective in reducing time, costs, and the number of tryout loops. The implementation of AutoForm-Sigma and the Smart Die draw-in process has led to significant improvements in the precision and efficiency of the OEM’s operations.


