In this blog, we’ll discuss a test and its outcomes that helped Chinese OEM SAIC GM Wuling (SGMW) to make an informed decision about their die spotting workflow.
In general, the gap between the upper and lower die for sheet metal stamping should be equal to the sheet’s thickness. However, during the forming process, the panel’s thickness cannot remain constant or uniformly distributed, as it stretches in all directions to induce the plastic deformation needed to ensure stiffness in the final part. This means the gap between the dies must match the sheet thickness to prevent unwanted deformation or scratches, which would reduce the panel’s quality and make it unacceptable to customers.
Die spotting aims to ensure the correct, unequal gap between the tools. This is a very time- and resource-consuming activity performed during tool tryout.
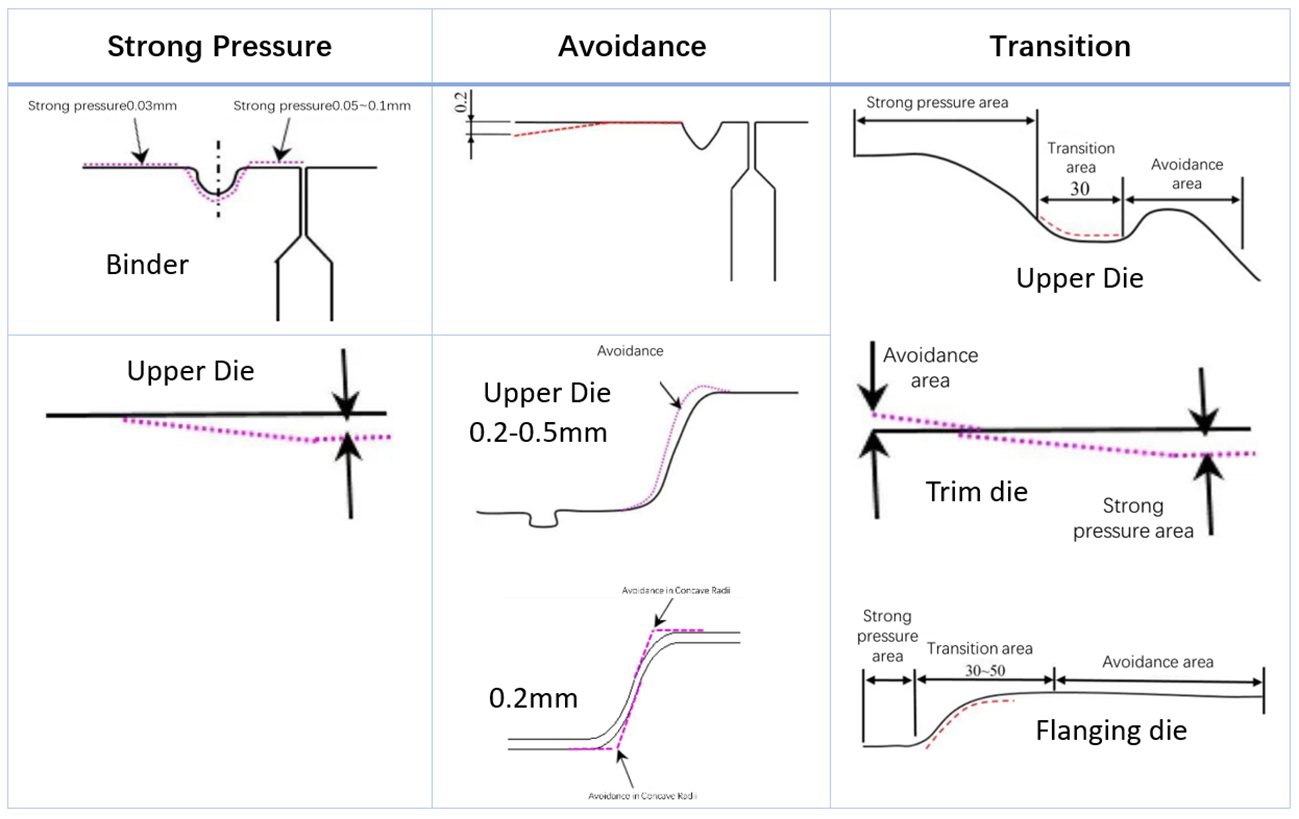
To achieve this goal, SGMW identifies four different areas where different pressures (and therefore different gaps) are applied:
- Strong pressure area: The gap between the upper and lower die is smaller than the sheet thickness.
- No treatment area: The gap is exactly the sheet thickness.
- Avoidance area: No contact between tools and sheet (unloaded areas).
- Transition area: Areas between strong pressure and either no treatment or no contact area.
To shorten die spotting activities, these areas are set up on the milled geometry according to the scheme summarized in the table below. The dotted lines represent the actual milled geometry, while the black continuous line shows the nominal geometry.
How are these areas checked in reality? Since the measurement would be difficult and time-consuming, it is standard practice to relate the pressure to different coloring shades. The stamped sheet is evenly brushed with blue paint on both sides and placed between the tools. The amount of paint remaining on the tools defines the type of pressure according to four shades:
- Heavy coloring: High pressure
- General coloring: No treatment
- No coloring: Avoidance (no contact)
- Slight coloring: Transition
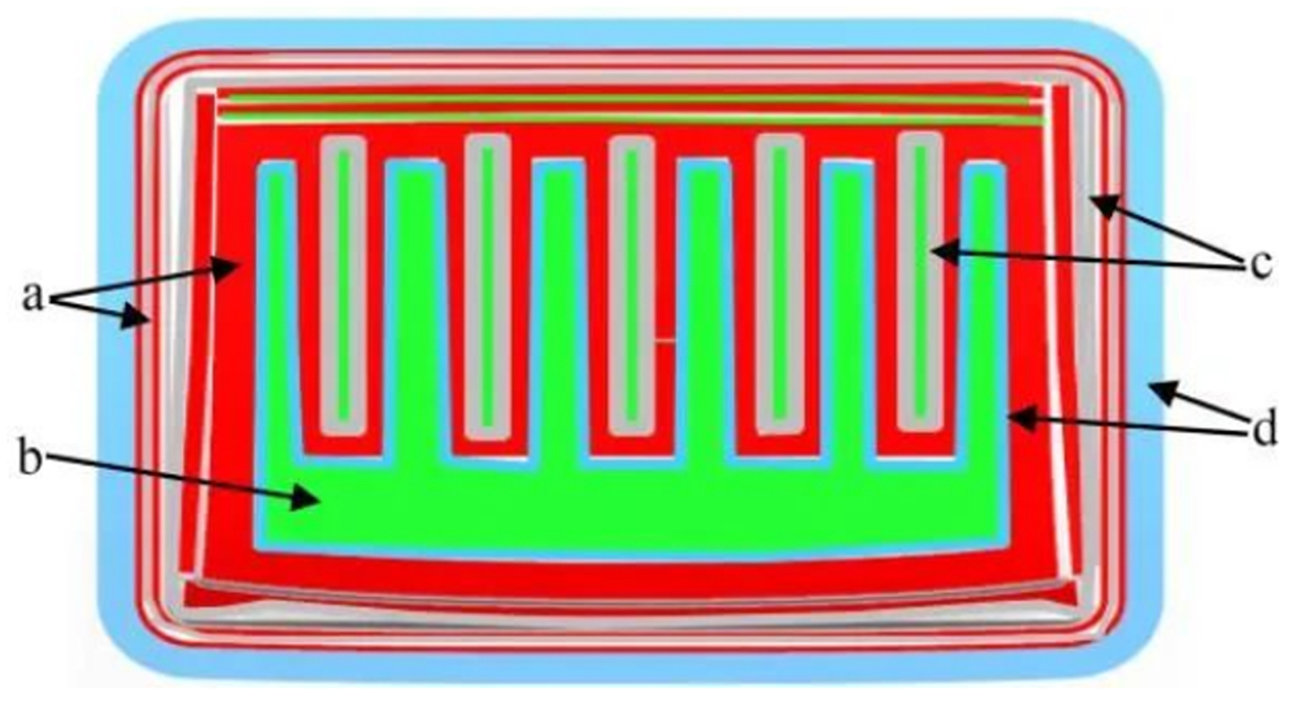
Figure 1: Example of drawing die clearance
Figure 1 shows these principles applied to a roof panel, distinguishing the following areas:
- a) Strong pressure area
- b) Untreated area
- c) Non-contact area
- d) Transition area
Mating, sealing, and hemming areas are subjected to high pressure. SMGW applied these principles to implement digital spotting, milling surfaces not based on the “nominal” but considering the four different gap/pressure areas, with values based on experience.
However, in a recent project, they encountered the following issues when checking the spotting status after milling:
- The clearance in the outer area of the drawbeads was much smaller than the sheet thickness, hindering uniform spotting in the large bearing zone such that the draw-in could not be controlled.
- Insufficient clearance between concave and convex radii resulted in a poor initial spotting rate due to non-uniform pressure distribution.
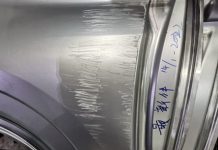
- Incorrect distance between bearing (high pressure) and non-bearing (no contact) areas created marks on the panel’s outer side, requiring significant time to resolve.
Figure 2 shows the status after many hours of die spotting.
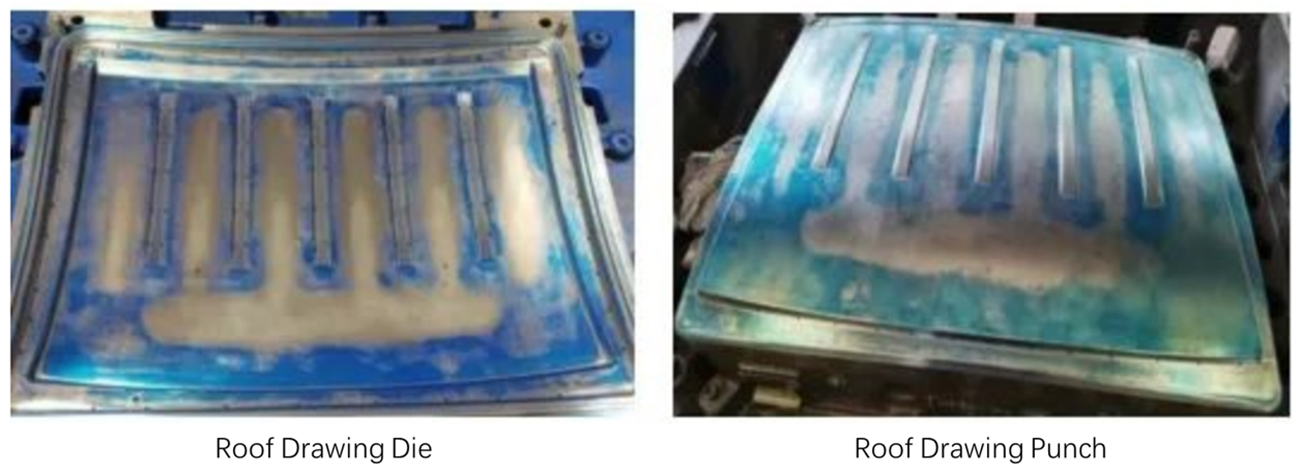
Figure 2: Bad “coloring” of the drawing die
Comparing Figure 2 with Figure 1, there are large areas with no contact where it should occur, leading to inconsistencies. After this experience, SMGW decided to use the thinning distribution values from the simulated stamped sheet, abandoning their long-used values for this project.
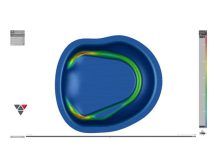
The thinning results of the drawing operation simulation showed a highly non-uniform thinning distribution (see Figure 3).
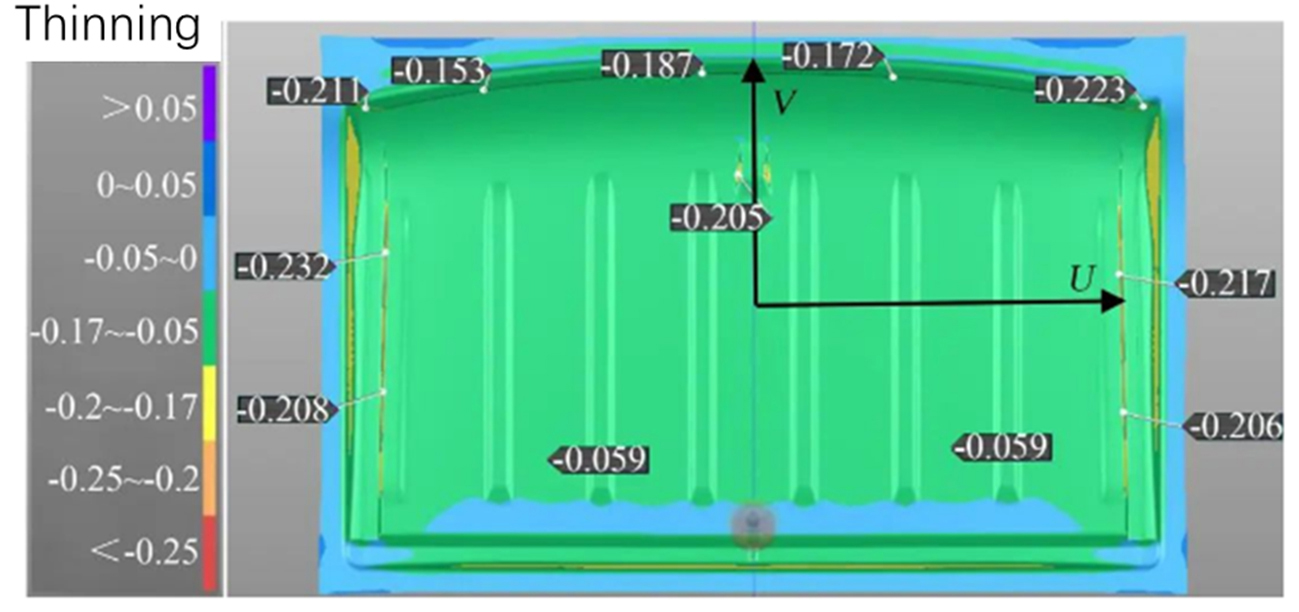
Figure 3: Thinning distribution after drawing
The non-uniform thickness determined the gaps between the upper and lower die. SMGW used the thickness distribution from the simulation as a basis for milling (see Figure 4).
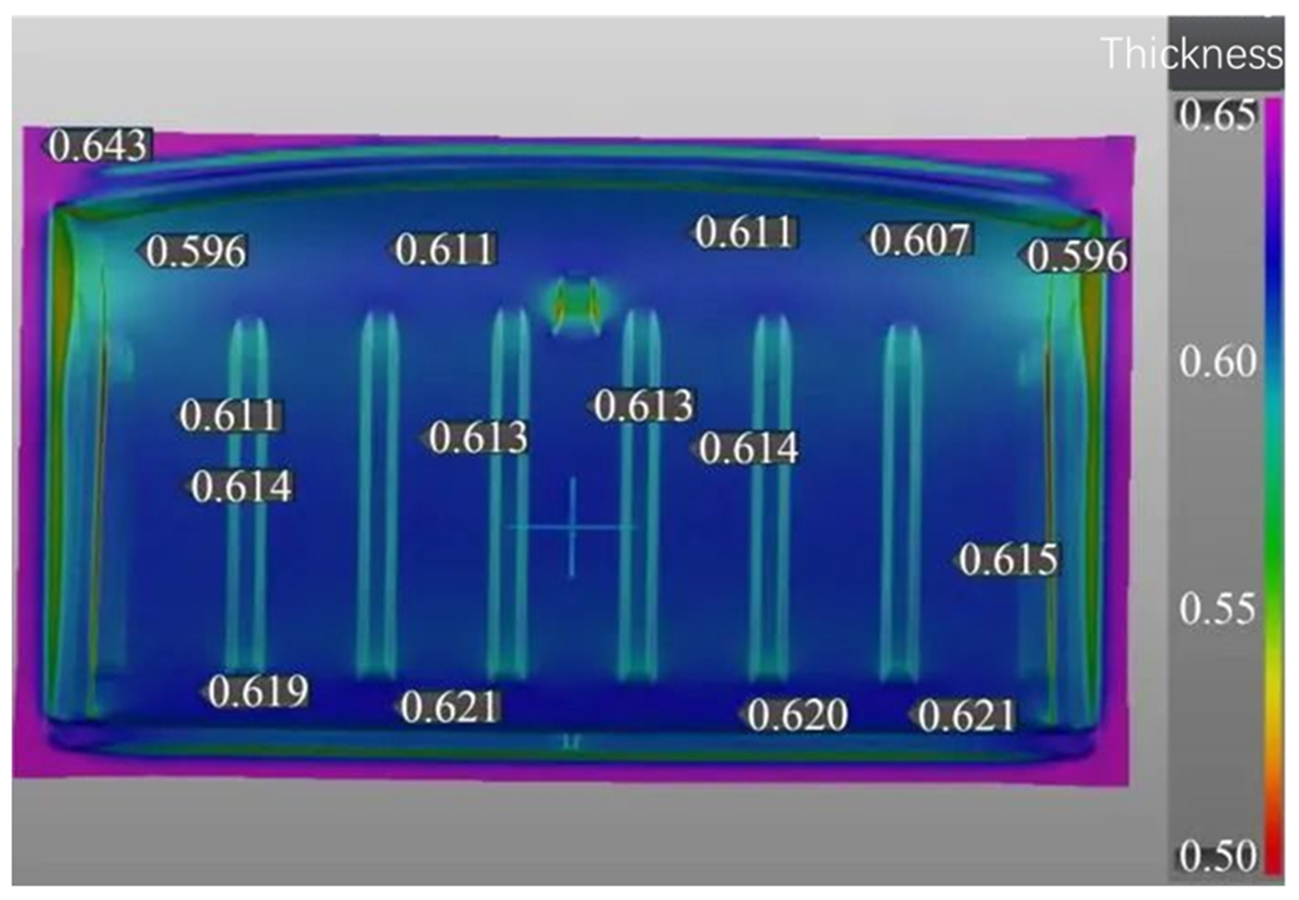
Figure 4: Thickness distribution after drawing
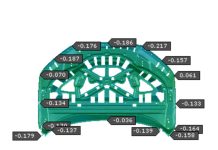
Based on the thickness distribution, SMGW rebuilt the die faces. The results are shown in Figure 5.
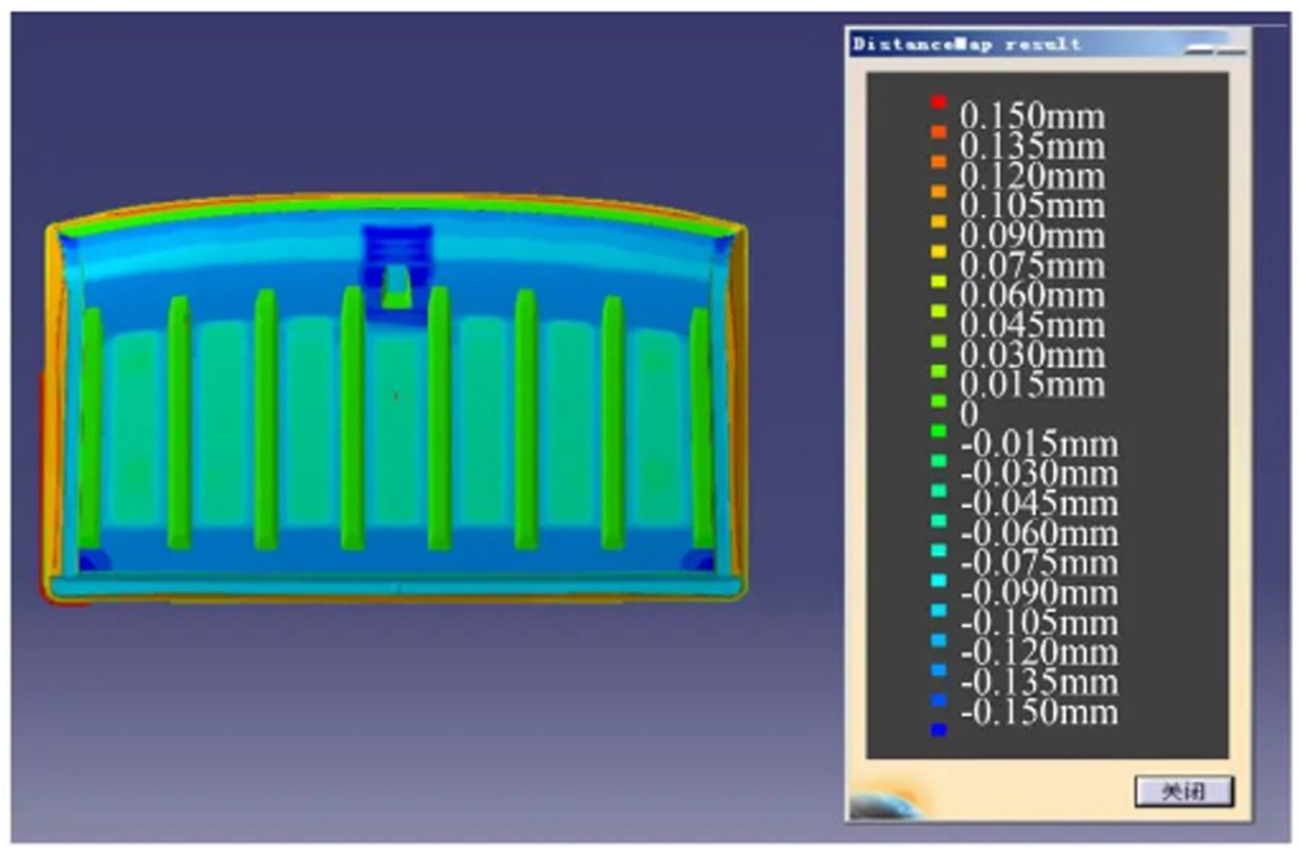
Figure 5: Thickness map applied to die surfaces in CAD
In Figure 5, the positive values indicate higher pressure areas, while the negative values indicate lower to no pressure areas. The new requirement for spotting is shown in Figure 6.

Figure 6: Requirements for die spotting
Comparing this map with the initial setup (Figure 1), the new configuration is quite different. The spotting activity on the new project (code CN113PR) was documented and compared to an old project (code E230R). The comparison is shown in Figure 7.
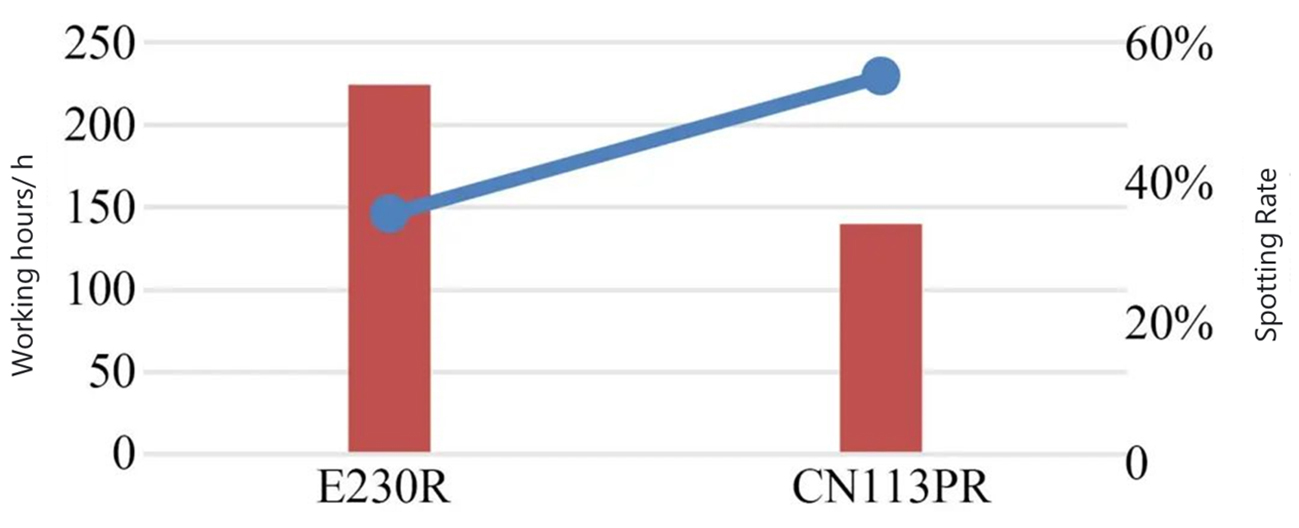
Figure 7: New and old project comparison
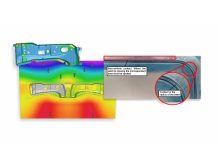
With the new method, they achieved a 58% spotting rate in 140 working hours, whereas with the old method, they could only reach 40% in 224 working hours. This represents a significant quality improvement (20% rate increase) at a lower cost (saving 80 working hours). The status of the sheet after the final check is shown in Figure 8.
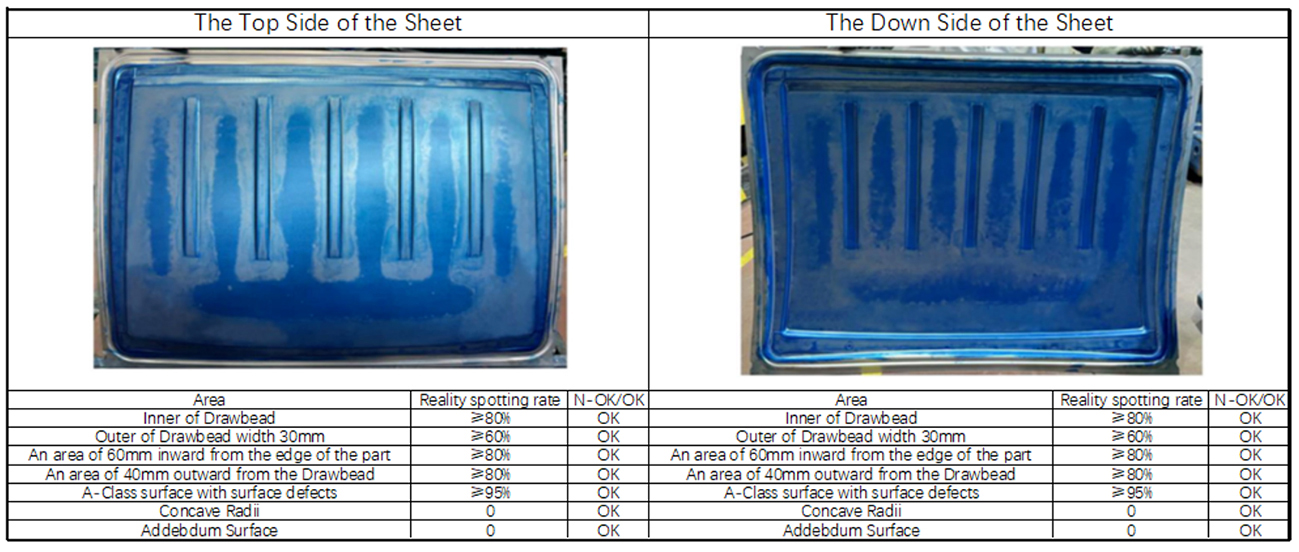
Figure 8: Final status of the sheet after spotting and related results
From this point on, SMGW decided to apply digital spotting according to the simulation results they obtained with AutoForm. This approach continues to save many hours in tryout while delivering higher quality to their customers.


