
Examining a real case study to assess our current standing
Our ultimate goal is to build car bodies efficiently, striving for the quickest turnaround and lowest cost possible.
This journey begins with the initial step: designing the car body. Next, product and process engineers break down the entire car body into smaller sub-assemblies and then into individual parts that are simpler to produce.
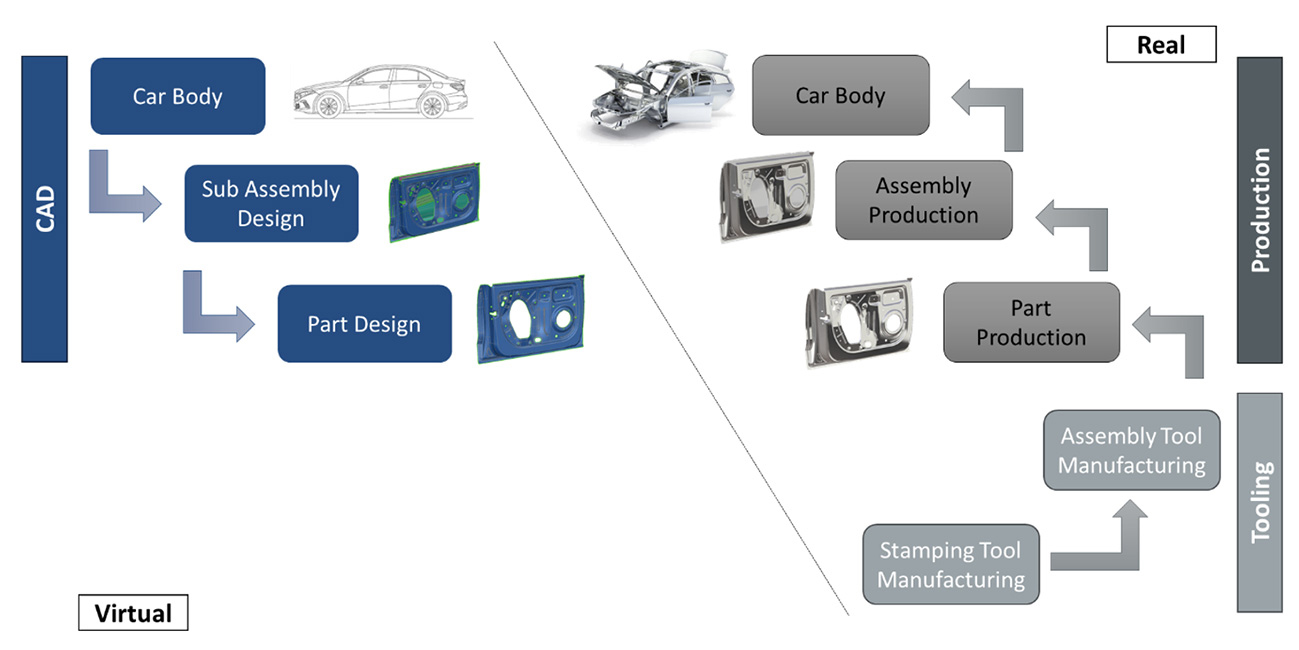
Figure 1 – From virtual car body to single parts to real car body
The real process develops in the reverse order. It begins with the assembly of individual parts to form sub-groups, eventually progressing to the completion of the entire car body.
We all know that, due to production processes, the actual part will differ from its design. However, it should mirror the design as closely as possible. But how close is acceptable? The GD&T department identifies control points on the entire car body. These points, along with others, are then marked on sub-assemblies and individual parts. The goal of setting dimensional tolerances and surface properties (like curvature and planarity) is to guarantee the quality and functionality of the final product.
The underlying assumption here is that meeting these “constraints” equates to achieving our target. Modern car bodies comprise 200-300 or even more individual parts. Each part must be manufactured to meet these predefined constraints.
But can we really be sure that compliant individual parts lead to compliant sub-assemblies and, ultimately, a compliant car body? The answer to this question is far from straightforward!
This was the dilemma facing our client’s assembly engineering team when they needed to modify an already functional and in-production sub-assembly for crash-test compliance. They had to add two reinforcements, being aware of the risk of assembly issues. For this reason, they invested all their expertise and effort to mitigate this risk.
However, during their initial trial of the new assembly, they discovered that even their meticulous attention and professionalism were insufficient: the parts could not be assembled correctly due to misaligned holes, leading to problems during the pin insertion in the subsequent assembly stage.
Due to confidentiality, we can’t show a detailed image of the actual assembly interference, but we’ll illustrate its virtual counterpart.
When an issue like this arises during tryout, the immediate question is whether it’s a particular part or the assembly process causing the problem. By employing a typical trial-and-error approach and evaluating numerous countermeasures, a solution was eventually found. This process consumed significant time and resources, causing delays and escalating costs.
This led to a pivotal question: Could this have been prevented? And if so, how?
It was in pursuit of these answers that AutoForm was consulted, to determine whether the technology currently on the market could have offered a solution.
To answer this question, we rewound the tape to the point where assembly engineers begin process engineering. We started from scratch, considering the tools already built and parts stamped and assembled.
The steps of the process we implemented are outlined in Fig.2:
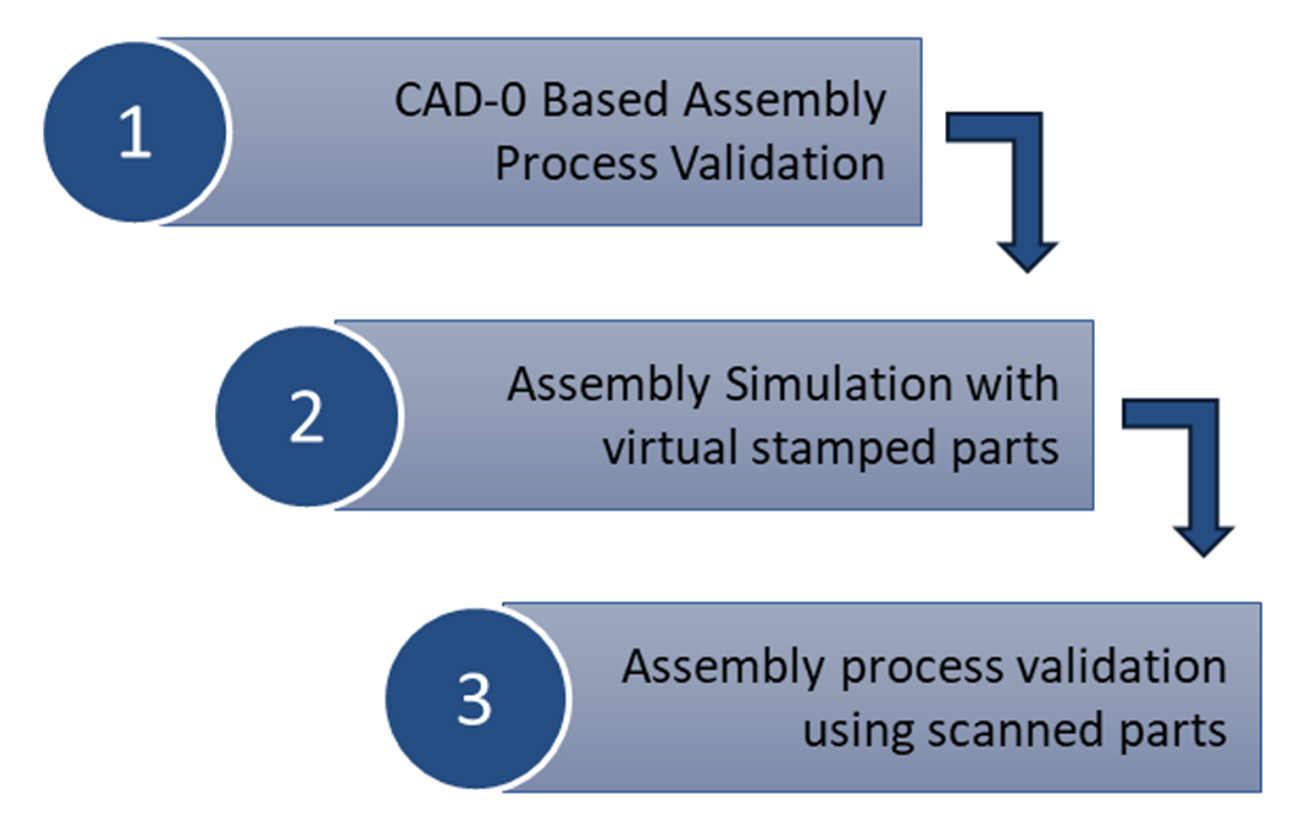
Figure 2 – Process analysis steps
Step #1 – Validating the Assembly Process Using CAD-0 Geometries
Like any assembly engineering team, our first objective was to determine whether the issue was caused by the assembly process. To do this, we simulated the process using CAD-0 geometries of the individual parts, aiming to replicate the scenario an assembly team would encounter during the initial stages of the process layout. Typically, at this stage, no results from single part stamping process simulations are available, so we started from the CAD-0 geometries.
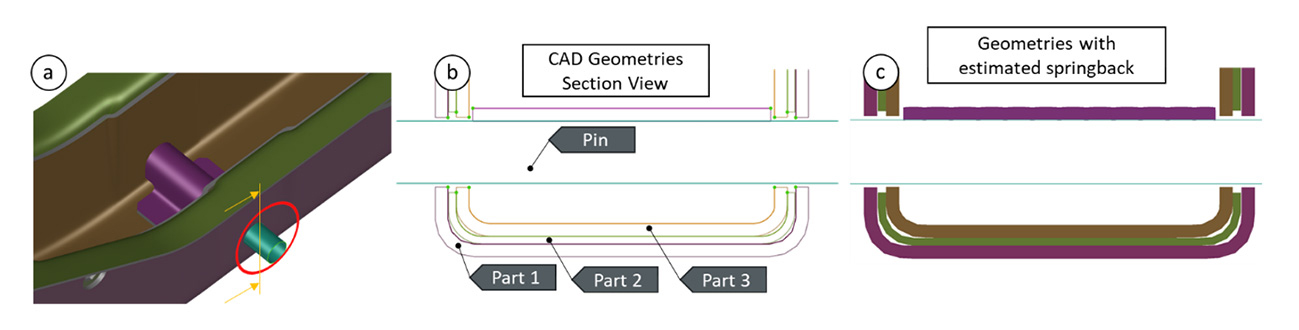
Figure 3 – Assembly process geometries input
Figure 3 illustrates the various phases of the assembly process simulation setup. In Fig.3a, we highlight the 3D model of the assembly, focusing on the problematic hole where we conducted a cross-section, as depicted in parts b and c. Fig.3b shows the CAD-0 section of the three parts.
We ran two simulations, the first using the CAD-0 geometries as is. For the second, we applied a “plausible” springback effect to all parts, creating deformed geometries, and then used these as our simulation input. This second simulation more accurately reflects a real-world scenario.
Our input mirrored the actual assembly process: identical clamp positions and closure sequences, welding spots and order, sequence of sub-assembly parts, and tool shape.
The results of both simulations revealed no issues attributable to the assembly process.
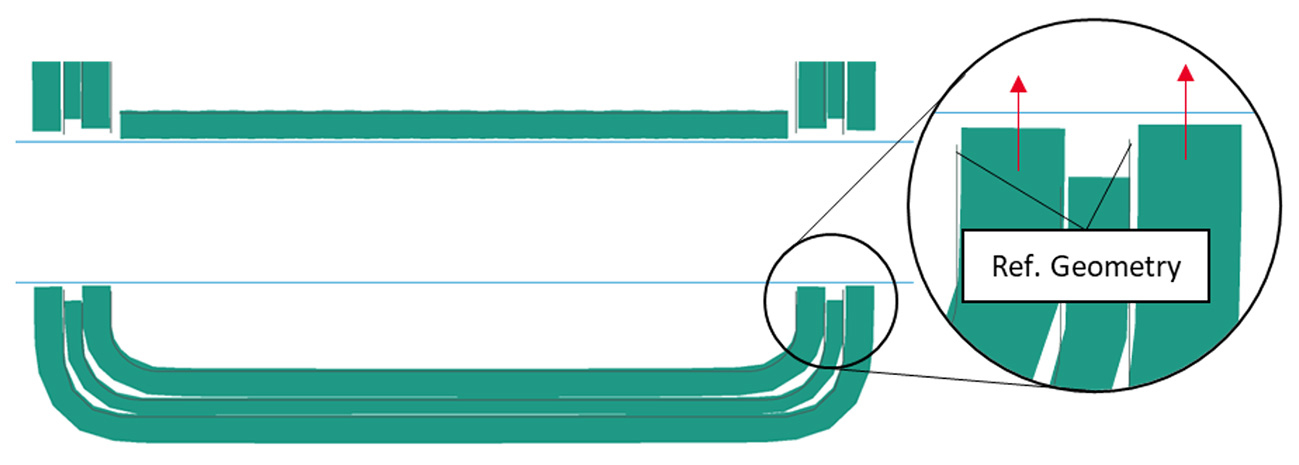
Figure 4 – Results of the assembly simulation
Figure 4 shows the results from the second simulation, where the “deformed” parts were used as inputs. One observation was a minor reduction in the clearance between the edge of the hole and the pin (detailed in Fig.4). This slight change may indicate a trend that should be further investigated, particularly when assessing the assembly results using geometries derived from simulated stamping processes (our next step).
Step #2 – Validating the Assembly Process with Virtually Stamped Parts
Without changing the process setup, we replaced the preliminary estimated parts with the outcomes of the finally validated stamping process. The results of this step are displayed in Fig.5. Notably, in this scenario as well, we anticipated no interference between the edge of the hole and the pin.
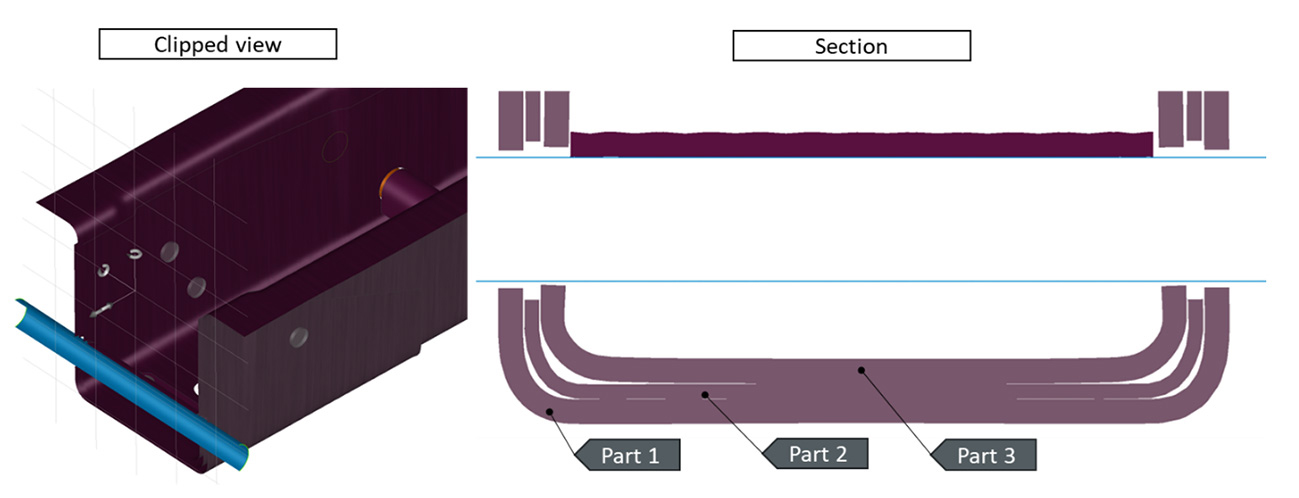
Figure 5 – Assembly simulation using virtual stamped parts
Step #3 – Validation with Scanned Parts in the Assembly Process
Having completed the first two analyses, we procured scans of the actual delivered parts and used these in our assembly process simulation. Essentially, we replaced the simulated parts with the scanned ones. The simulation results, presented in Fig.6, reveal the interference issue exactly as it occurred in reality.
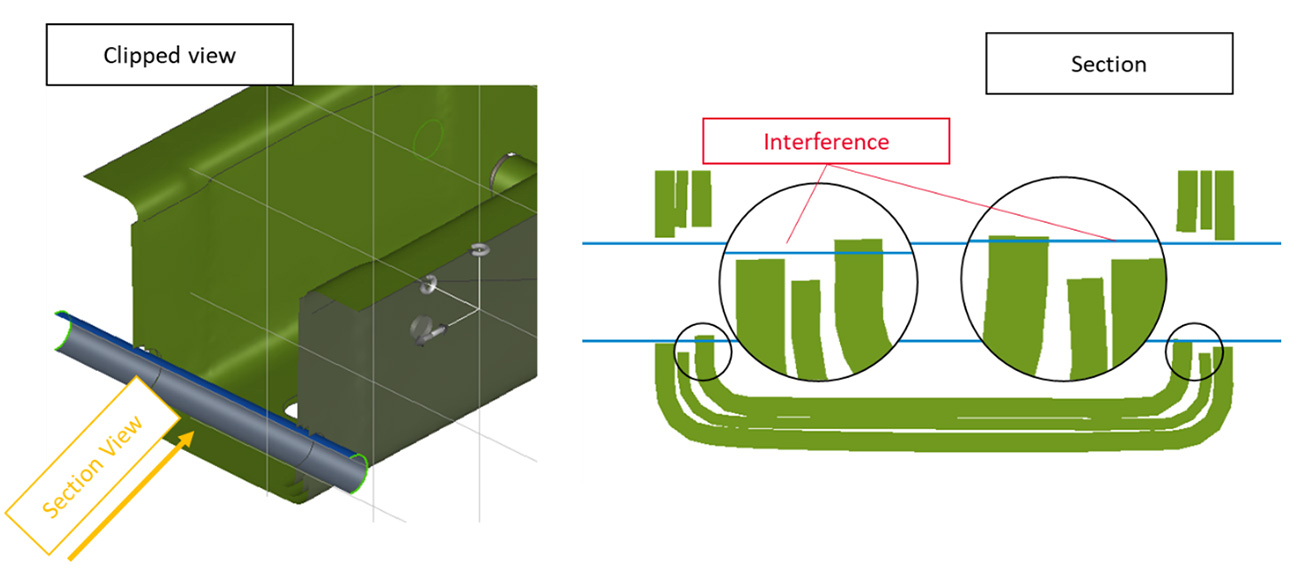
Figure 6 – Assembly simulation with scanned parts geometry
Figure 7 serves as a comprehensive summary of all the analyses conducted.
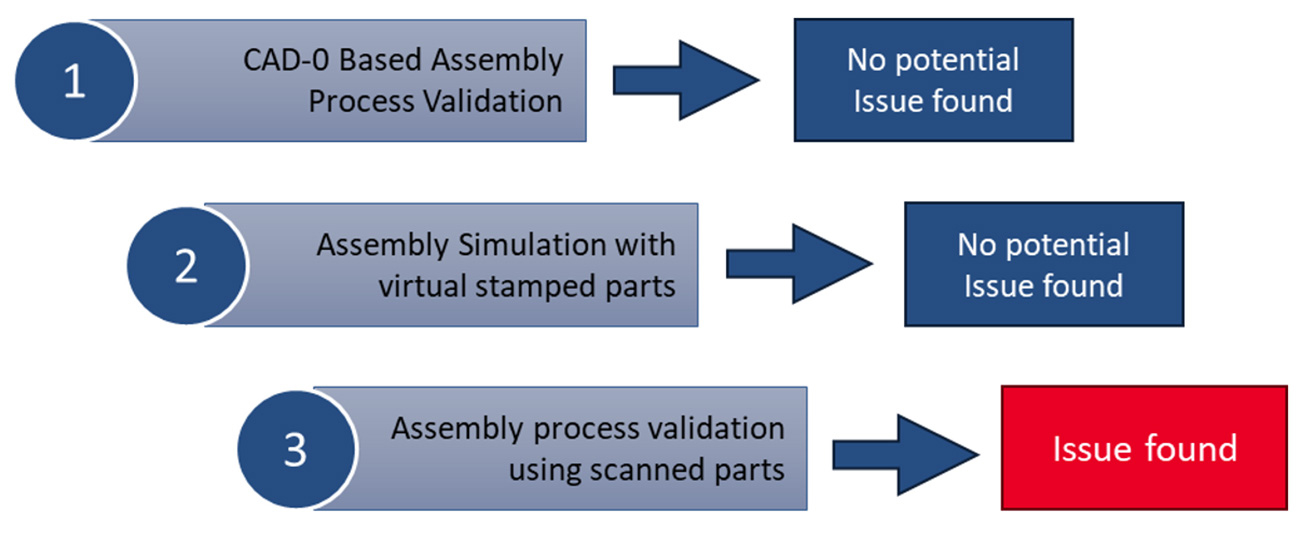
Figure 7 – Summary of investigations
Comparing the outcomes of Steps #2 and #3 leads to a logical conclusion: the simulated parts differ from the real parts used in production. However, both must be within tolerance limits, as non-compliant parts would have been rejected by Quality Assurance during acceptance.
So, what was the missing piece in this puzzle?
After reviewing the process it was soon clear that what we overlooked was analyzing the result variability in the stamping simulation! In Step #2, we based our assembly process simulation on the outcome of a single set of input parameters for stamping, thereby neglecting the “reality” of process parameter variability.
So, we revisited Step #2, this time performing a robustness analysis on all stamping processes to gauge the variability of outcomes based on fluctuating input parameters (such as material, lubrication, thickness, etc.). These results were then used to simulate the assembly process, enabling us to assess the impact of these variabilities on the final assembly.
Bingo! We arrived at the answer. While the stamping processes for individual parts demonstrated good robustness, the robustness analysis of the assembly process (shown in the image below) indicated that the issue could indeed occur!
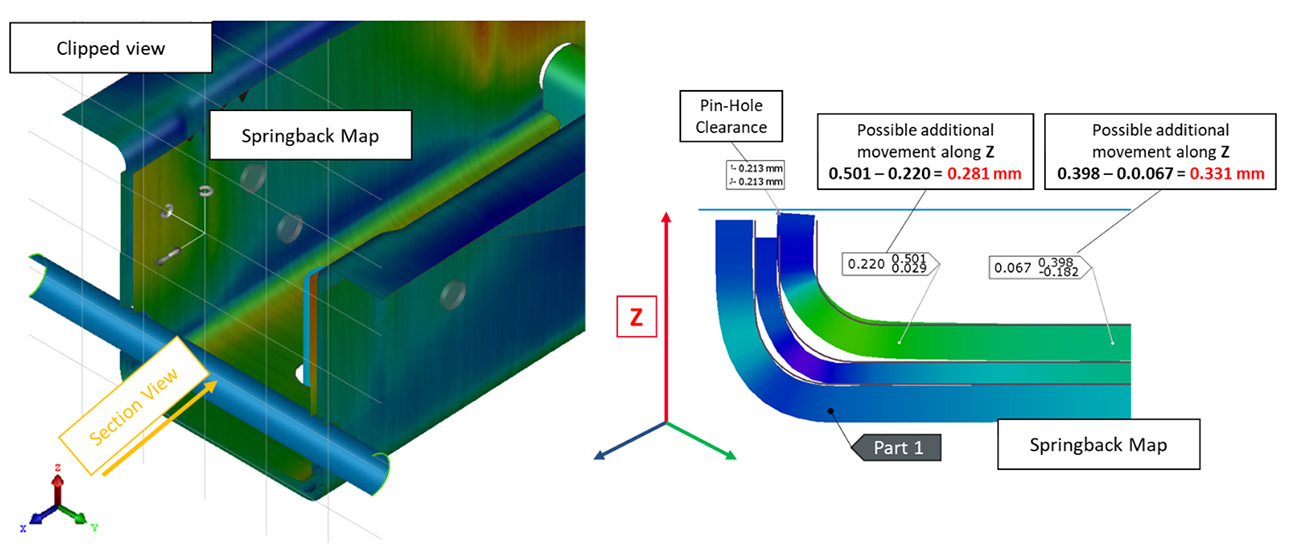
Figure 8 – Impact of springback variability on hole edge position
The additional movement along the Z-axis influences the position of the hole edge. Given that this movement exceeds the available clearance, it potentially leads to interference. The observed interference during the tryout could be attributed to increased springback in the inner part.
This revelation prompted us to consider the frequency of such occurrences. Was this a rare mishap, or was it a more common issue under these conditions?
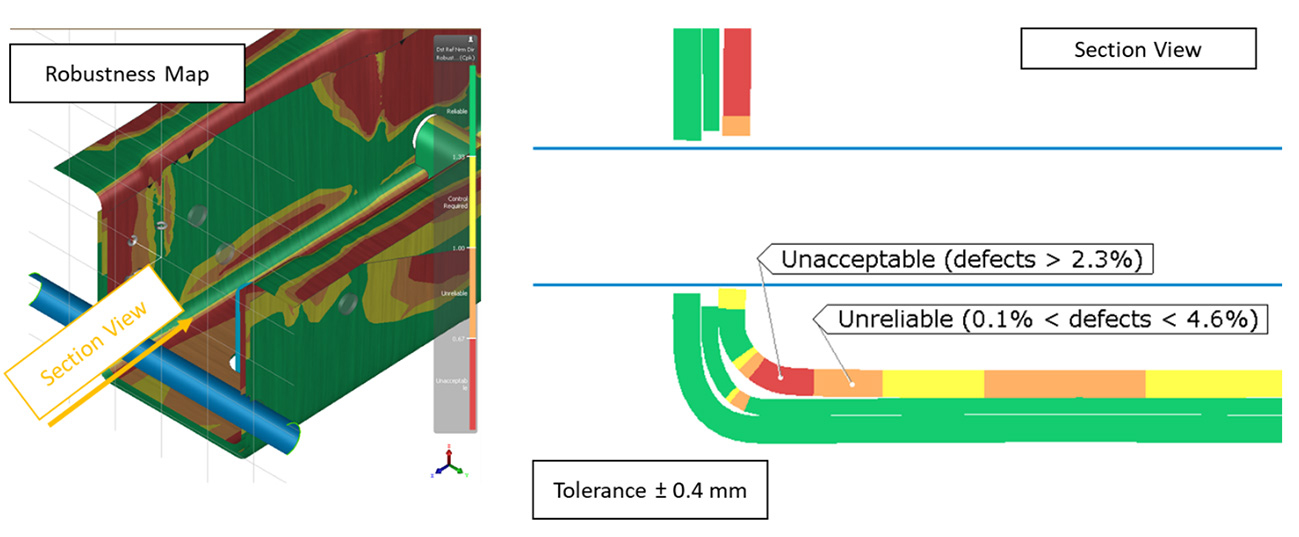
Figure 9 – Robustness of assembly results due to variability in individual parts
Our analysis indicated that the likelihood of this issue arising was significant, especially when applying the same rigorous standards used by quality control in manufacturing processes. Essentially, if the quality department had access to these results prior to tool manufacturing, they might have explored alternative solutions before finalizing the geometries.
“This project demonstrated how the technology that AutoForm provides can really help us improve our process, make it more effective, efficient and reliable, which will make our companies raise the quality and optimize the overall cost,” remarked the assembly quality manager of our client.
A critical takeaway from our analysis was the identification of material thickness variation as the most significant factor likely to cause this issue. A variation in material thickness during stamping could lead to assembly problems. This insight underscores the importance of comprehensive analysis to preempt problems throughout the process.
Therefore, the initial process, as depicted in Fig.1, should be revised as shown in Fig. 10. This revision encompasses not just the activities but also the timing and discipline across all departments, from engineering to manufacturing.
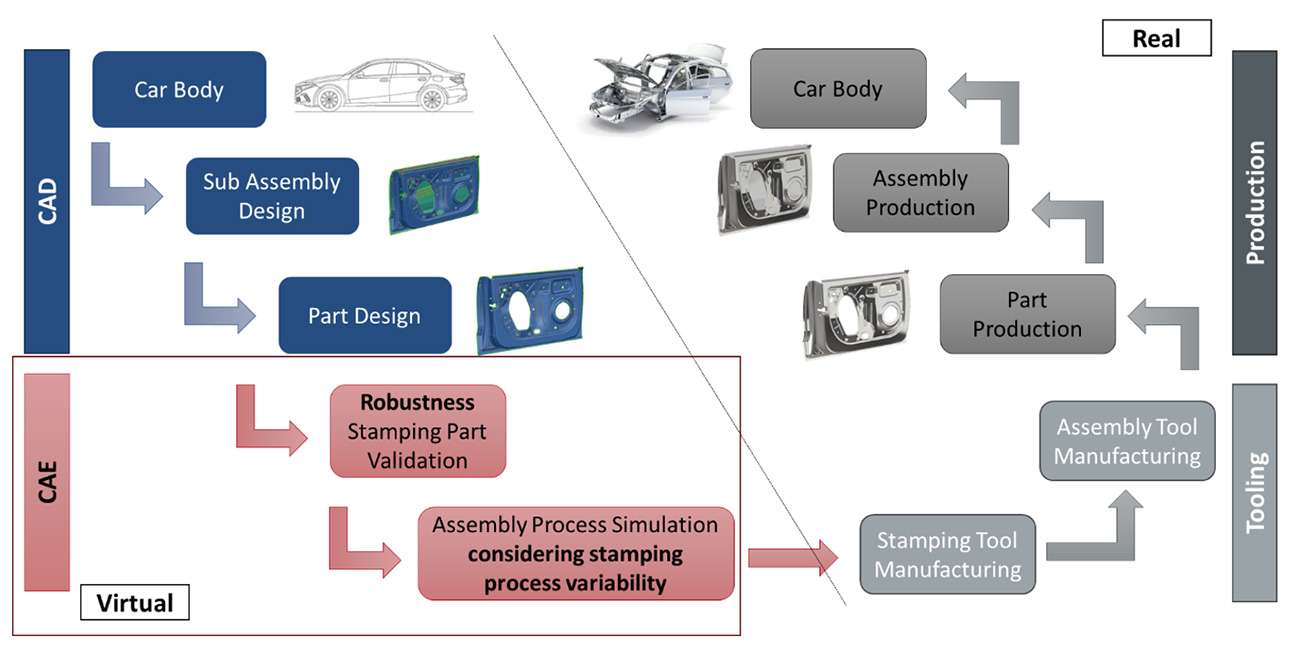
Figure 10 – Revised process flow: from design, to simulation, to manufacturing
Ultimately, our goal remains the same: to efficiently build high-quality cars.
We welcome your thoughts on this analysis. How would you address this issue? Insights from experts in the field would be invaluable!


?")

