
Stamping processes have reached unprecedented levels of complexity. Sharp edges and quick curvature changes, previously deemed unfeasible, are now often incorporated to meet aesthetic concerns and/or compact space requirements. Similarly, complex material grades such as ultra-high strength steels and aluminum are increasingly favored to address growing environmental concerns. Despite the heightened complexity, stamping tools are now designed and manufactured on tighter timelines than ever. As far as formability prediction is concerned, these trends push the limits of the traditional formability analysis based on the Forming Limit Diagram (FLD). In the first part of this article, I will give an overview of the conventional FLD and discuss its limitations. In part two, I will illustrate the Advanced Formability Analysis framework implemented in AutoForm R10. This new approach eliminates the shortcomings of the traditional FLD, providing access to significantly improved failure prediction capabilities, by evaluating only two central overviews: The Advanced Formability View and Diagram and the Surface Failure View and Diagram (see Figure 1).
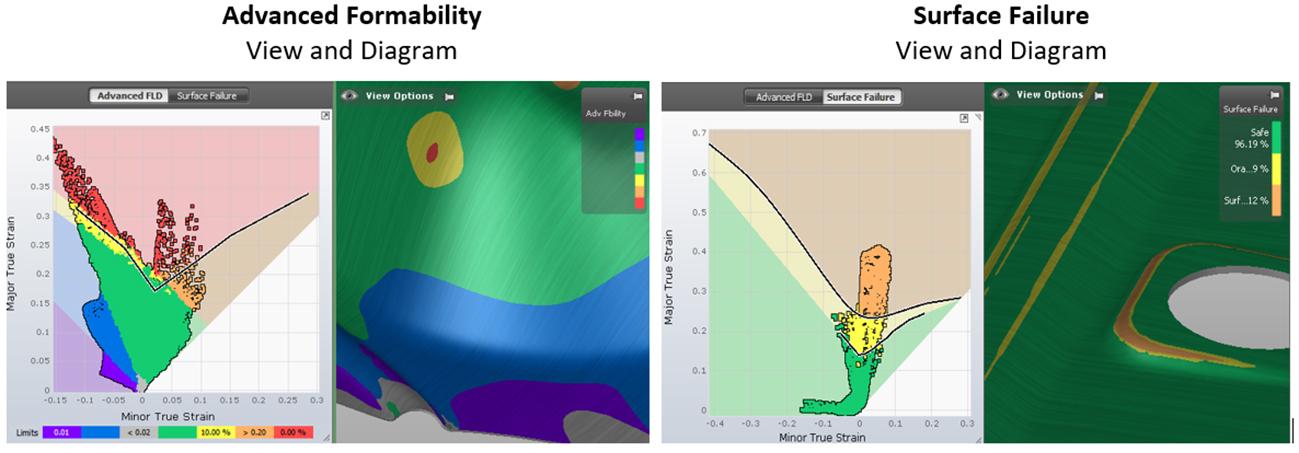
Figure 1: Overviews in the Advanced Formability Analysis (AFA) framework
The Traditional FLD: What to expect (and what can hold you back)
To understand the limitations of the traditional FLD analysis, let’s take a look at how the Forming Limit Curve (FLC) is determined. Figure 2 depicts a set of Nakajima experiments, where each sample is used to identify the major and minor strains at which localized necking begins.
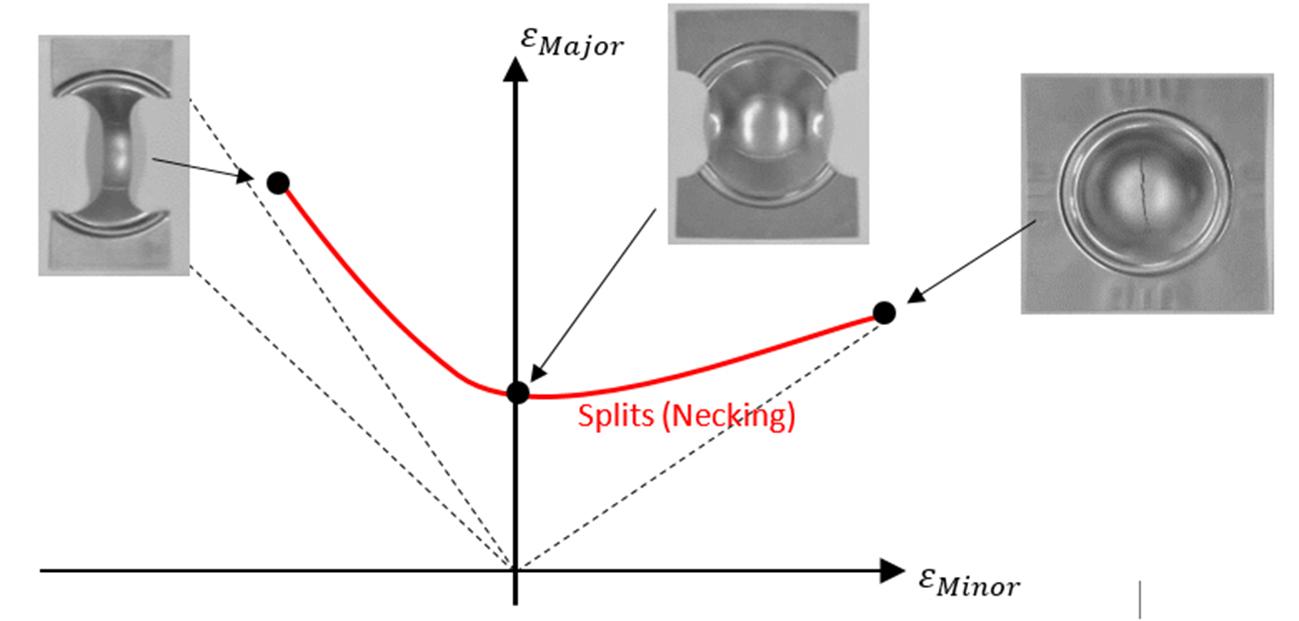
Figure 2: Nakajima Experiments and the traditional FLD
These points are then connected to deliver the FLC. This procedure has the following properties, which also define its limitations:
- The Nakajima experiments are carried out in a single stroke, stretching the material continuously until necking occurs. This condition primarily corresponds to what happens in the first drawing step of real forming processes. However, it no longer applies to multi-stage operations, where the loading condition can change abruptly. The predictive power of the traditional FLD is known to be significantly reduced under these so-called nonlinear deformation / non-proportional loading conditions
- The Nakajima experiments are conducted under the assumption of pure stretching (i.e., no bending). In fact, the punch radius of these experiments is around 50mm, whereas the blank is usually a few millimeters thick. The measured formability limits are therefore generally too conservative in regions where the part is strongly bent. In practice, this limitation is primarily encountered in regions following drawbeads as well as in flanging and hemming operations, where the material is bent on relatively small radii.
- The Nakajima experiments are carried out with open tools. This means that the material is not loaded in the thickness direction. Again, this condition is realistic for most deep drawing operations, as double-sided contact usually only occurs under the blankholder, where failure is not expected due to compressive deformation. However, whenever ironing or coining operations are included in the process, the traditional FLD fails to provide a realistic limit. This condition is often encountered in practice, e.g., when coining (restriking) radii to minimize springback or when ironing flanges to increase their height.
- The Nakajima experiments are designed to capture failure by localized necking. Metallic materials do not fracture abruptly when stretched under tension, but they first undergo strong thinning in a bounded region called a local neck. However, there are circumstances in sheet metal forming where necking is prevented. In these cases, the material can be deformed until the actual fracture limit. As no localized necking occurs, the FLC is not an appropriate limit, so a separate fracture curve/model must be defined. Luckily, in stamping applications, this kind of direct fracture happens only in the following well understood circumstances:
- Surface cracks: As mentioned above, bending stabilizes deformation and thus postpones and may even prevent necking. However, ultra-high strength steels and aluminum materials can reach the fracture limit on the material surface, even though the material remains stable through its thickness. This leads to surface cracks, which cannot be reliably predicted by the FLC.
- Shear cracks: If the material is deformed along the left diagonal in the FLD, it experiences an equal amount of tension and compression in the sheet plane. Its thickness therefore remains unchanged and necking cannot occur. In fact, the FLC is not even defined in this region. However, if stretched significantly, the material will eventually fail at its fracture limit. These shear cracks are occasionally observed on the die radius of geometries with a very large drawing depth, such as kitchen sinks or fuel tanks.
- Edge cracks: The stress state on the blank edge is uniaxial, meaning that under tension, it should neck before fracture. However, blank edges are usually sheared, which significantly alters its material properties and surface features. Particularly for some sensitive materials, failure on the edge can occur differently in accordance with different microscopic features (or defects) before the actual necking limit of the material is reached.
- Through thickness compression: Negative hydrostatic stress states, as encountered during ironing and coining operations, prevent necking. As a result, the material can deform until the actual fracture limit.
Advanced Formability Analysis
The Advanced Formability Analysis (AFA) framework in AutoForm R10 extends the traditional FLD to account for all the mentioned physical phenomena. This has been achieved through a careful selection and implementation of methods and models from recent scientific literature that are capable of capturing these effects. A detailed description of these models is beyond the scope of this article. The interested reader is, however, encouraged to read the corresponding chapter in the AutoForm R10 White Paper, which can be downloaded from the AutoForm Service Center.
The benefits of the advanced physical modeling provided by AFA will be illustrated here based on some practical examples.
Figure 3 depicts a fender (Courtesy of Mats Sigvant, Volvo Cars) where localized necking is observed in two locations. Traditional FLD analysis fails to identify these spots, whereas AFA pinpoints their criticality precisely. The decisive physical effect that enabled the improved formability prediction, in this case, is nonlinear deformation. In fact, the blank is initially stretched over the punch in both planar directions but as soon as the small radii around the wheel line are formed, the material gets locked in the tangential direction and is further deformed only in the radial direction. This generates a typical nonlinear deformation path, as seen in the Advanced FLD plot in figure 3. Also note that in the Advanced FLD, the point marker colors no longer necessarily follow the region boundaries of the traditional FLD. The point becomes critical even though it is significantly lower than the FLC. This is because the marker color is selected based on the advanced algorithm running under the hood and represents the accurate evaluation of a point’s criticality. Whereas the marker position is identical to the traditional FLD, enabling a direct comparison with this approach.
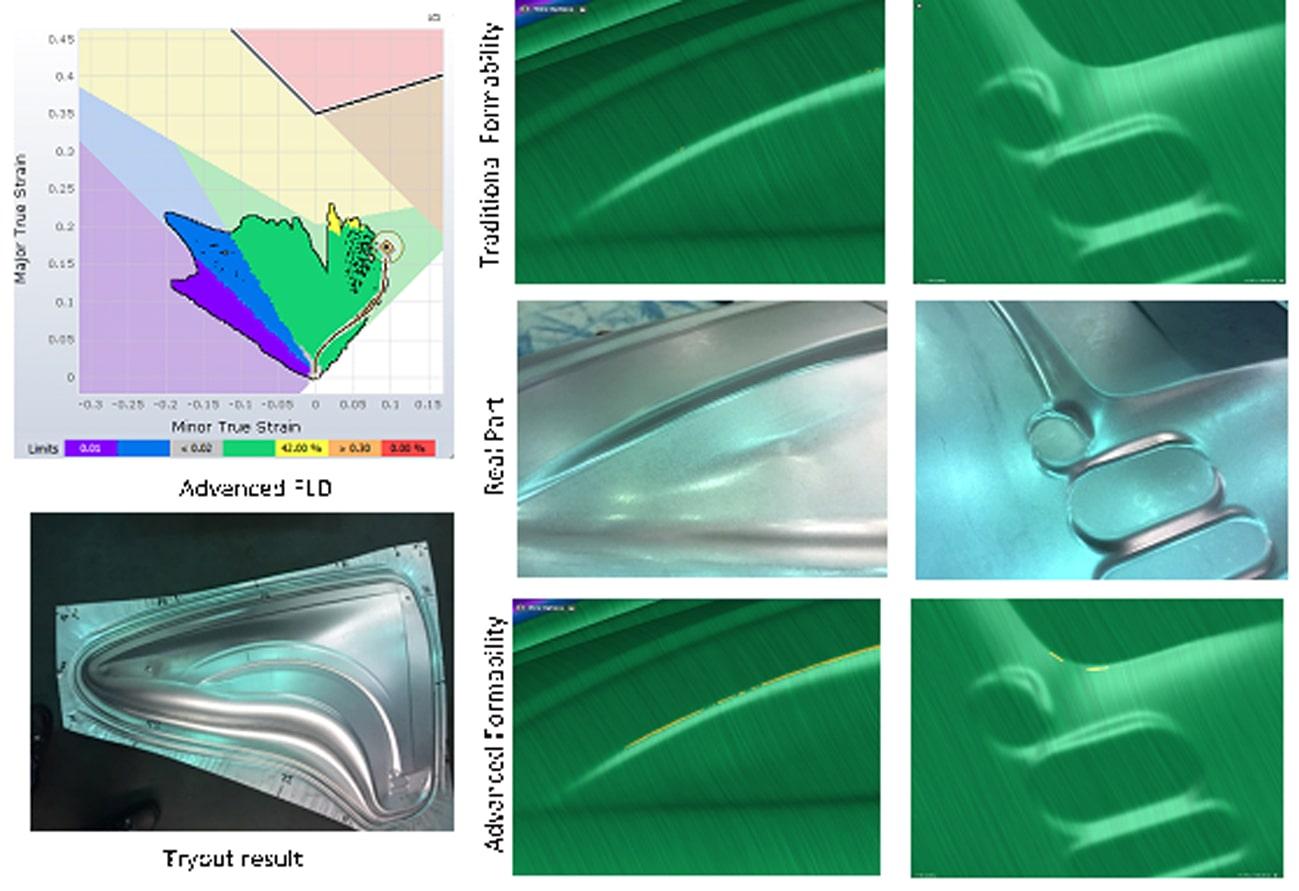
Figure 3: Necking prediction under nonlinear deformation (Courtesy of Dr. Mats Sigvant, Volvo Cars)
Figure 4 shows a drawbead section, for which the traditional FLD reflects strong criticality. As we know, failure seldom occurs directly after the bead, so this reported criticality is primarily due to the fact the bending and rebending over small radii in the beads is not correctly accounted for. The AFA view delivers a far more realistic depiction of the situation.
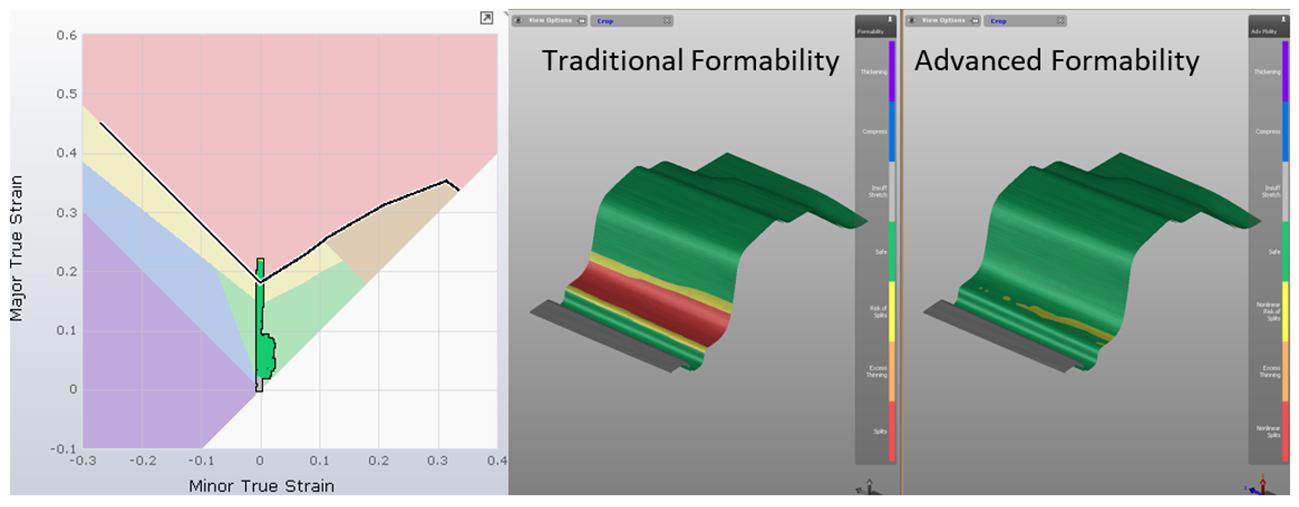
Figure 4: Improved formability prediction after drawbeads
An ironed circular flange is shown in Figure 5. Again, traditional FLD evaluates this situation as critical. In reality, however, the deformation occurs under strong compressive stresses through the thickness, which prevents necking, as correctly predicted by AFA.
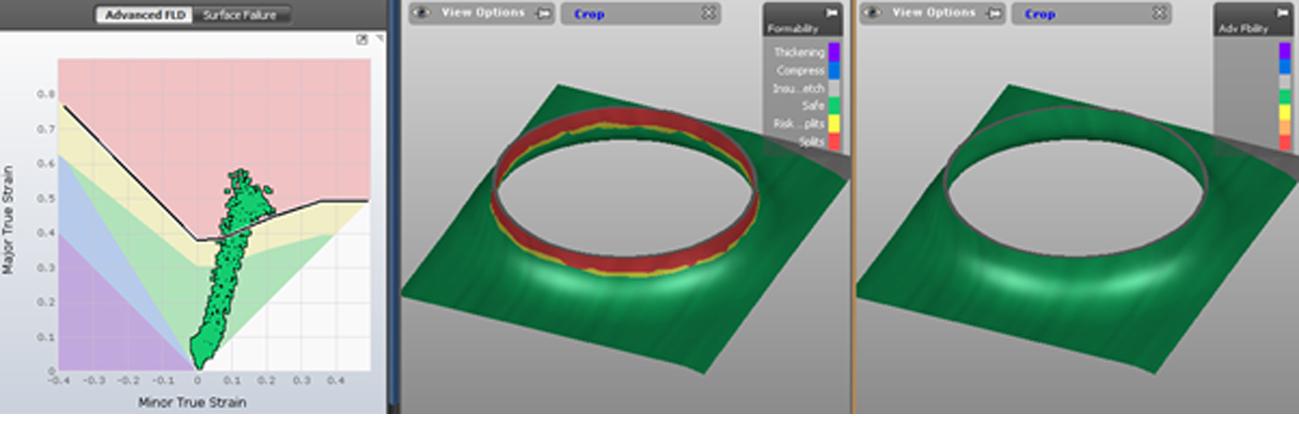
Figure 5: Improved formability prediction on an ironed flange
Figure 6 illustrates a section from a structural part; the material is 1.8mm thick and it is bent over a 3.3mm radius. AFA predicts that there will be no necking. Note that in this case, the traditional FLD would deliver the same prediction, because the strains at the middle layer of the sheet are very low and thus, a through thickness neck is not expected. However, as reflected in the relatively low fracture curve, this UHSS material is quite sensitive to direct fracture. Consequently, the Surface Failure view correctly predicts that cracks will appear on the surface of the material.
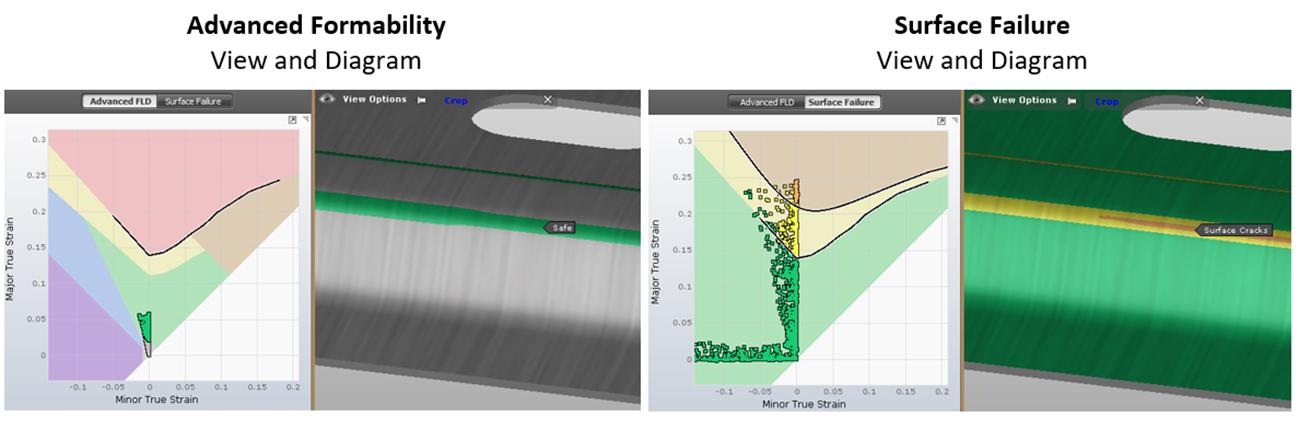
Figure 6: Thick UHSS sheets bent over small radii can lead to surface cracks even though no necking occurs through the thickness
Conclusions
Formability analysis is an important step in the design of most stamping processes and usually requires careful attention. To that end, significant research has been invested in recent years to increase the accuracy and reliability of formability predictions. This article illustrates how this body of findings can be transferred and applied to industrial processes with the aim of generating tangible improvements in numerical formability predictions.


?")


