
Let’s Look at Report Transparency for Sharing Simulation Files
In this article Karan Bhise, Application Engineer AutoForm USA, demonstrates the ease of generating reports for your simulation projects using AutoForm.
It is very imperative to transmit important information and forward the results of a finished simulation to other decision making authorities. There are multiple ways in which an Autoform simulation result is circulated for evaluation. Some prefer sending the simulation files for viewing, which needs the receiver to have AutoForm-Process-Explorer or AutoForm-Presenter seat, and, more important, be familiar with the interface. Another way includes taking a screenshot of important result-map pictures and drafting a PDF/Excel or a Power Point file with all the necessary results. This second option requires a fair amount of manual effort after every simulation to create a report for publishing results.
In AutoForm, we have implemented a dedicated and efficient module that helps you automate the process of reporting results in either PDF format or Excel format: AutoForm-Report Manager. This requires a one-time effort to build a template which is going to then remain constant throughout further reports for the different simulation files. Repeatability, consistency and time saving, just to name a few, are the advantages of this method of knowledge transfer.
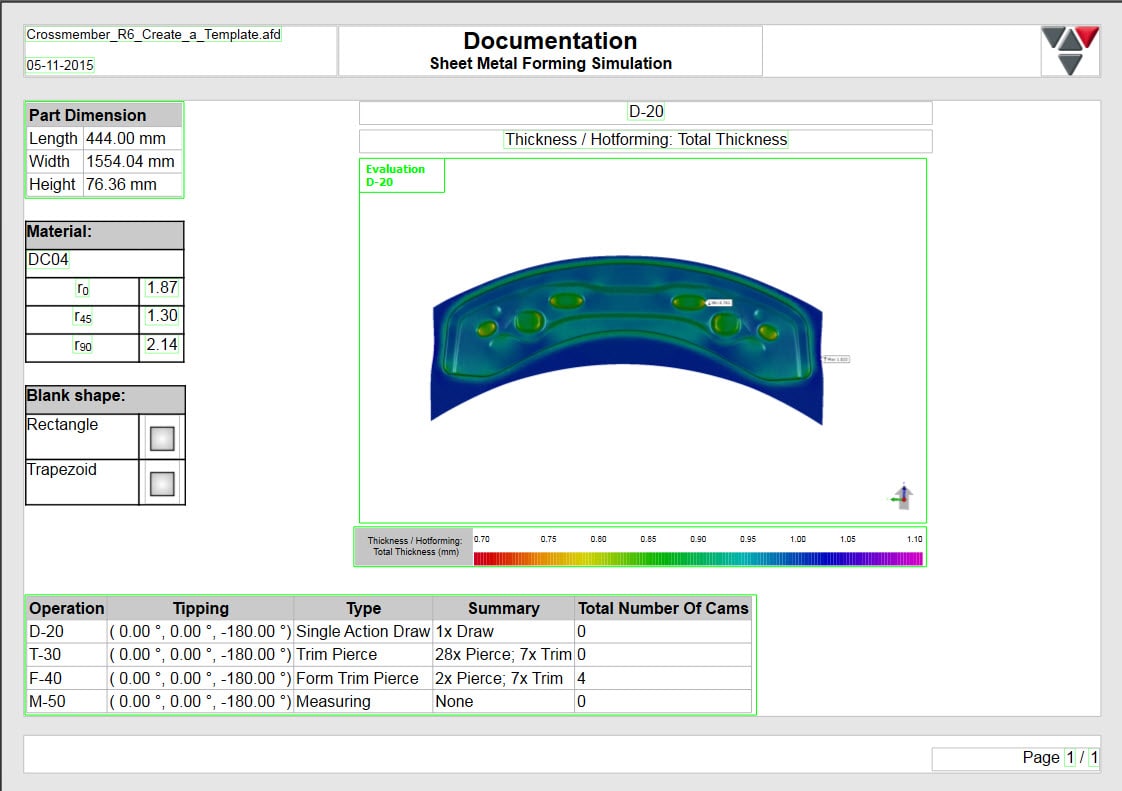
Fig 1. Example of a page created by AutoForm-Report Manager
Let us explore some peculiarities AutoForm-Report Manager is equipped with the scope of simplifying the creation of simulation results reports:
- Dynamic and Static template layout
- Dynamic Tables
- Use of Standards and the divergence from using the proper standards
Let’s go a bit into details and see what these features are for.
- Dynamic and Static template layout
Sheet metal forming simulations reports are usually made of different pages showing different types of inputs (settings) or output (results) data, with different levels of detail. Some data, especially outputs, can be reported on pages having the same layout while other information require a different, and tailored layout.
For example, the same layout fits quite well to the report Formability or Thinning results; we have quite often seen customers displaying the pictures of the sheet at the end of each operation with the appropriate results variable map. Yet keeping the same layout of all generated pages and what is actually changed “just” the result variable shown on it. In order to achieve this with the least amount of effort, AutoForm developed the concept of the Dynamic page. Dynamic page allows users to create different report pages having the same layout but showing different result variables.
On the other hand, a Static page, defined in the template, shows up the same way a single page does in the report. This is used for pages that include the part geometry, material and other information related to the company. A Static template page can also be used to display sheet results but its use is recommended when more specific information from the project is needed and therefore a dedicated layout is required that otherwise does not meet or completely accomplish the goal.
We can say that the Dynamic template page simplifies the request by showing different results at the same or after different operations, thus requiring a minimum amount of time. The users gets to decide whether they want to publish results of just one operation, (draw or trim or form and so on), or multiple operations.
The advantages brought by the use of the dynamic template can be summarized as:
- Time saving in the report creation regardless the number and the type of operations.
- Consistency in updating the same report as the project is updated because of changes applied to process parameters, geometries, etc.
- Always be compliant with report standardization (where in place) within a company or between company and suppliers.
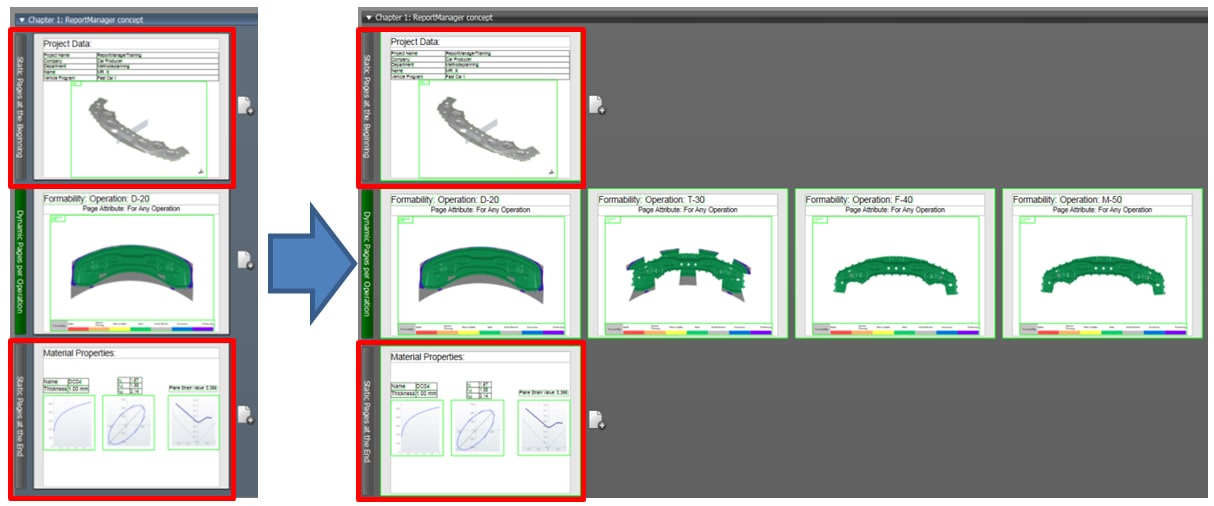
Fig 2. Dynamic page example.
The figure above shows an example of a report that a dynamic page can generate. The template contains three pages (on the left of the picture): the first for the part geometry, the second is the dynamic for the formability at the end of each operation, and then another page for the material properties. The report generated by the software would contain six pages: one for geometry, one for the material and four pages reporting the formability results at the end of each OP. Thinking about how many times this report can be updated as the process engineering evolves for instance, will give you an idea about how powerful this feature is.
- Dynamic Tables
Dynamic tables, just like Dynamic pages, are a tool to report results for each operation. A Dynamic table reports result for all operations in a tabular format. When the Dynamic table object is added to the template, a table with all operation names contained in the simulation file appears on the screen. To add the result variable to the table it needs to be dragged over the table and released (drag&drop). So, based on the dynamic table definition, if I select the thinning picture for a Draw operation, the table will update with pictures from all operations at the same time step as shown in the picture below.
Figure 3 below is an example of a Dynamic table where important information about the process set up regarding the tipping, type of operations performed at each station as well as a summary of the tools and cams used is shared. In order to get to this point, all the user has to do is select the relative variable from the report manager for one operation and drag&drop it in the table. The table will update itself with the same data for all operations.
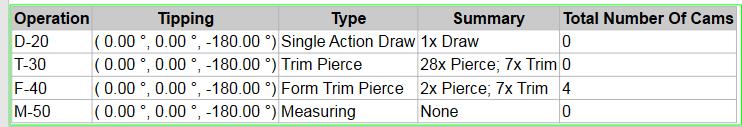
Fig 3. Dynamic table example.
Another important application for the dynamic table is the displaying of the Die Operation Lineup (DOL) shown in the image below. Just by means of 1 button poke, we can update the entire Die Operation Lineup reducing a lot of time and effort.
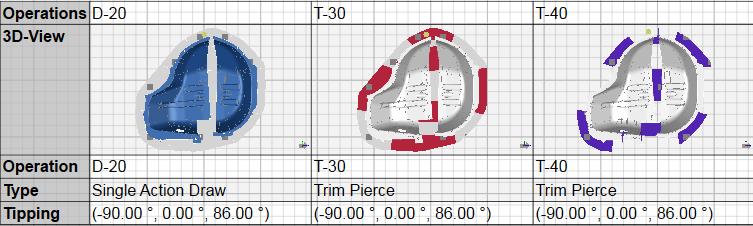
Fig 4. Die operation lineup using dynamic table.
3 Use of Standards and the divergence from using the proper standards.
Processes like the die designing, the evaluation of simulation results, etc. are standardized processes across the metal forming industry. In addition, these processes are different for each material used. While reporting the results and the design parameters, full transparency concerning compliancy, with special standards and terms of the standards themselves, are extremely important. AutoForm-Report Manager can effectively be used to inform readers about any deviations or use of special conditions. This can be achieved by means of the standards tab directly available in the AutoForm Report Manager GUI; the picture below shows an example of reporting the results with a direct comparison with what was set in the Standard.
![]()
Fig 5. Deviation from company standards highlighted.
AutoForm-Report Manager can thus be used to effectively reduce the users’ effort, saving them from manually creating and duplicating reports every time for new simulations, as well as inform customers and supervisors of any standards-deviations. The customization of the report templates allows for very detailed reports and simple one-page report available at your fingertips.
“A discovery is still a thought process, until it is published”
New visitors, contact us to place your article on this blog! Otherwise, if you sign up you can always receive one email per month, covering our top four recommended blog posts. Join us now!


?")

