
Although it has only recently gained familiarity in the industry, “Digital Twin” was a term first introduced by David Gelernter in his book Mirror Worlds, published in 1992. At the time, technology was in full evolution, with personal computers on the rise and software in rapid development. In his book, Gelernter made predictions about what all this would represent for the future: The Day Software Puts the Universe in a Shoebox…How It Will Happen and What It Will Mean.
30 years after the book’s publication, the “Universe in a Shoebox” is now a metaphor that perfectly describes the World Wide Web. A successful prediction for Gelernter.
Ten years after its publication, another of the book’s predictions was put to the test. In 2002, Michael Grieves of the Florida Institute of Technology is recognized as the first to apply the Digital Twin concept to a manufacturing process, introducing it as a model that underlies the Product Lifecycle Management (PLM).
Today, Digital Twin is the name given to digital replicas of real physical assets, such as processes, people, places, systems and devices, that can be used for multiple applications. As an industry tool, Digital Twin is used to virtually predict the results of manufacturing processes in several areas.
In this paper, we will briefly discuss the applications of the Digital Twin for manufacturing stamped metal panels, the advantages it can provide, and the tools that are currently available to assist us in this task.
The challenge: Apply the concept to the complex world of assemblies and stamped metal sheets
When considering such an ambitious issue, it’s difficult to define a main challenge. There are several barriers to overcome, not only in terms of technical knowledge, but also behavior. Here, the core aspects of project management will become increasingly important. The technical basis is necessary, but not sufficient; everyone involved in the development chain will need to be ready with the relevant hard and soft skills.
Productive relationships, healthy communication, and the exchange of information are all essential skills for the concept to be successfully applied.
Communication is critical because the application of a Digital Twin model implies that several departments need to work together to develop and manufacture a stamped part. However, these same departments are subject to their own individual goals, generally with cascading organizational structures, featuring a high level of internal competition.
The Digital Twin model connects the virtual world with the real world, consisting of two processes (Figure 1):
- The Digital Master – Created in the virtual world during the design and engineering phase. It represents the intention of the “as designed” process or model.
- The Real-life Twin – The physical realization of its Digital Master on the shop floor, providing “as manufactured” data (and eventually feeding back to the Digital Master).
The first is virtual; the engineering departments of product, process and manufacturing work to develop a feasible product with a robust and manufacturable process.
The second lies in the physical world; the tool shop aims to build what has been developed in the Digital Twin. Here lies one of the biggest challenges: how to execute what engineering has developed with enough precision to meet the expected results.
The solution: An integrated platform across departments
The development of an assembly or a stamped part involves many departments, each with individual objectives and goals (Figure 1). During product engineering, the aim is to come up with a design that meets the car’s approval specifications. The goal of manufacturing engineering is to create a robust tool that can produce parts repeatedly with the highest quality level possible. At the press shop, the objective is to develop a process that meets the requirements with the lowest possible material consumption. As such, the individual goals of each department can generate conflicting interests, resistance to changes and internal competition. However, we must not forget that everyone, without exception, aims for maximum efficiency, the best time to market and consequently, the best cost-benefit ratio.
As a result, every stamped part undergoes the same general stages, as described in Figure 2.
The Digital Master is a digital model that undergoes every stage of the “virtual world” described in the figure. It must be developed to meet all of the requirements necessary for part approval, from the initial stages of product development to the final validation for tooling construction. In this concept, the Digital Master becomes a unique file where all changes are recorded. Then with the assistance of an ERP system, all involved parties communicate openly about the changes made so they can undertake the necessary actions in a timely manner, thus ensuring perfect Product Lifecycle Management (PLM). Software products such as AutoForm® include features to guide the user through all the steps of this creation. These management systems can also store the file containing the entire history of changes and remarks made throughout the process.
This prevents late
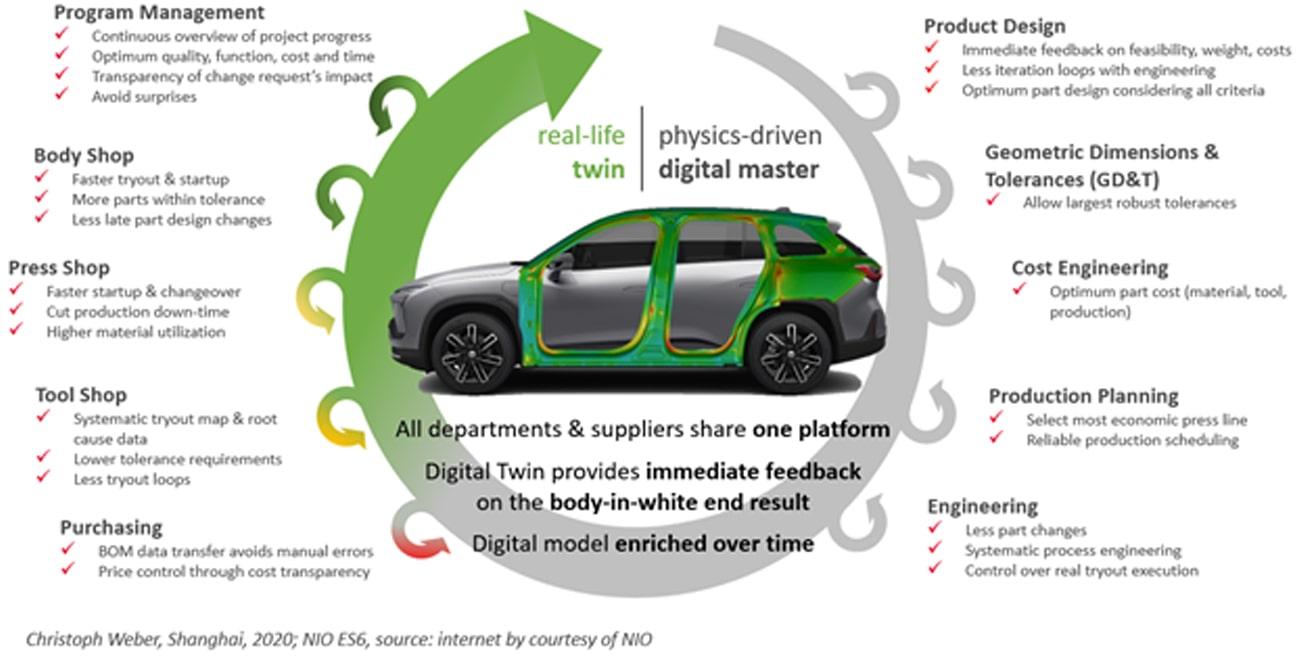
Figure 1: Overview of relevant departments
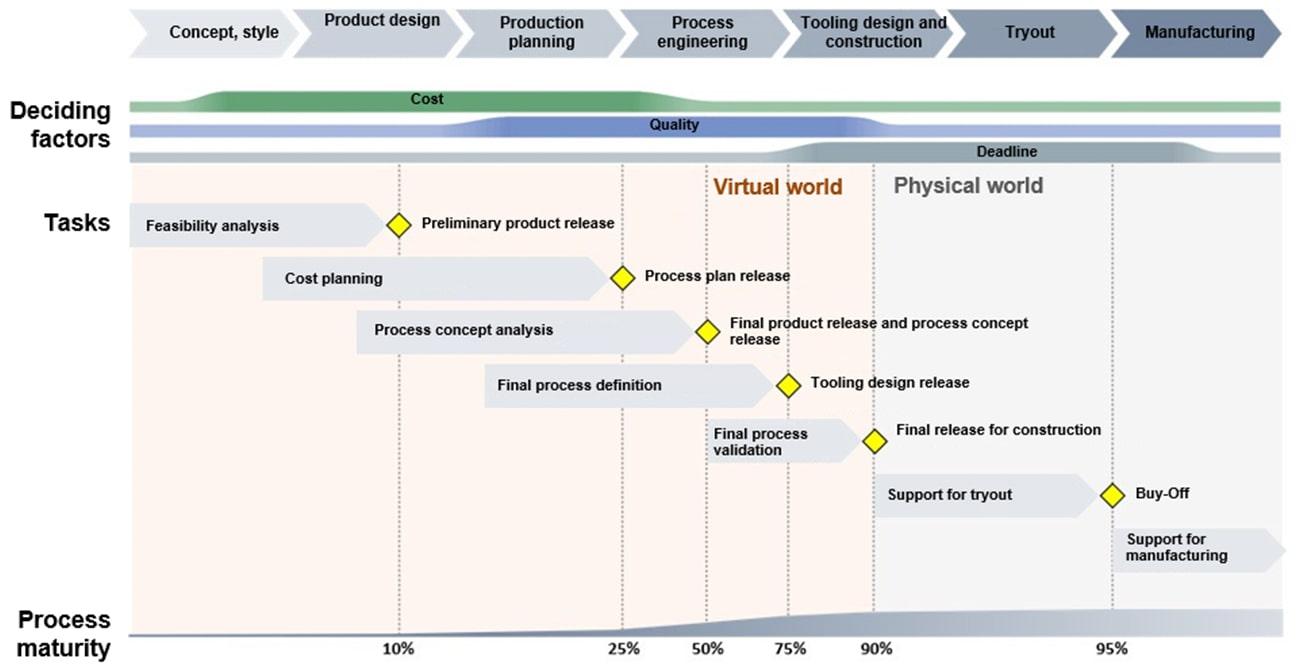
Figure 2: Development stages of a stamped part
process/product changes, which are common in the traditional model yet are extremely costly and cause delays. Figure 3 explains the relationship between the cost of a change and the time it is made (red curve) considering the maturity of the process; it also relates the capacity to execute this change considering the same maturity (green curve). Both reflect different strategies and the current technology suggests that with the right use of resources in their optimal configuration, the processes can be designed to predict and mitigate problems, making the green curve feasible.
There are several reasons why we might defend an integrated platform where the workflow is seamless and enables consistent results; the reductions in cost and time may be the most persuasive, as these can be measured.
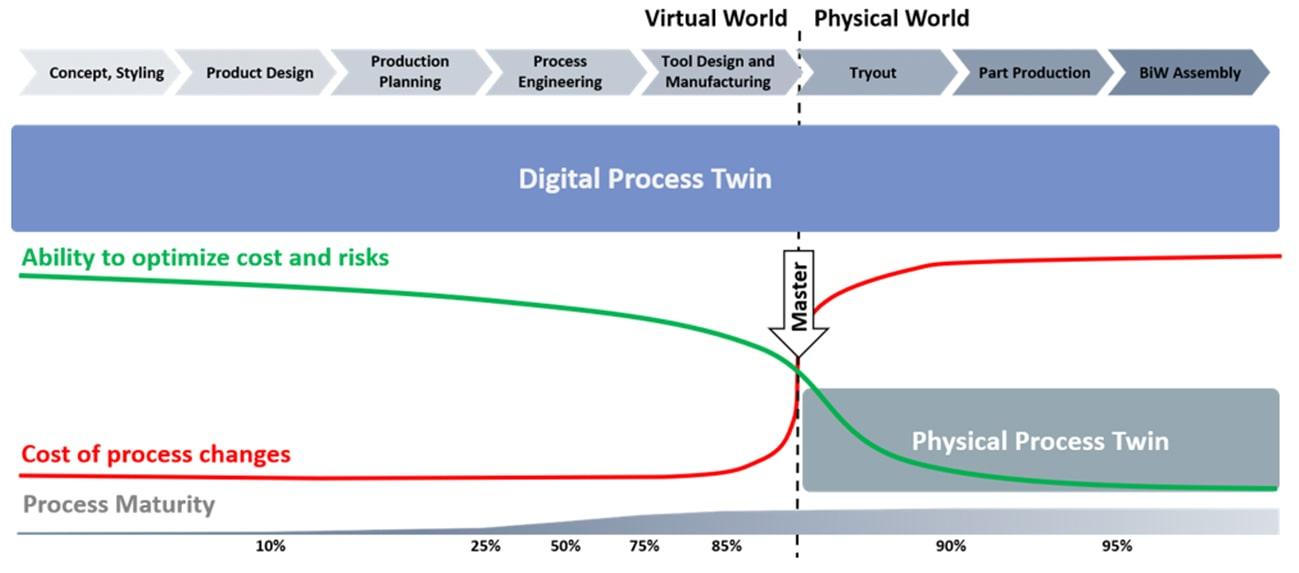
Figure 3: Cost of modifications
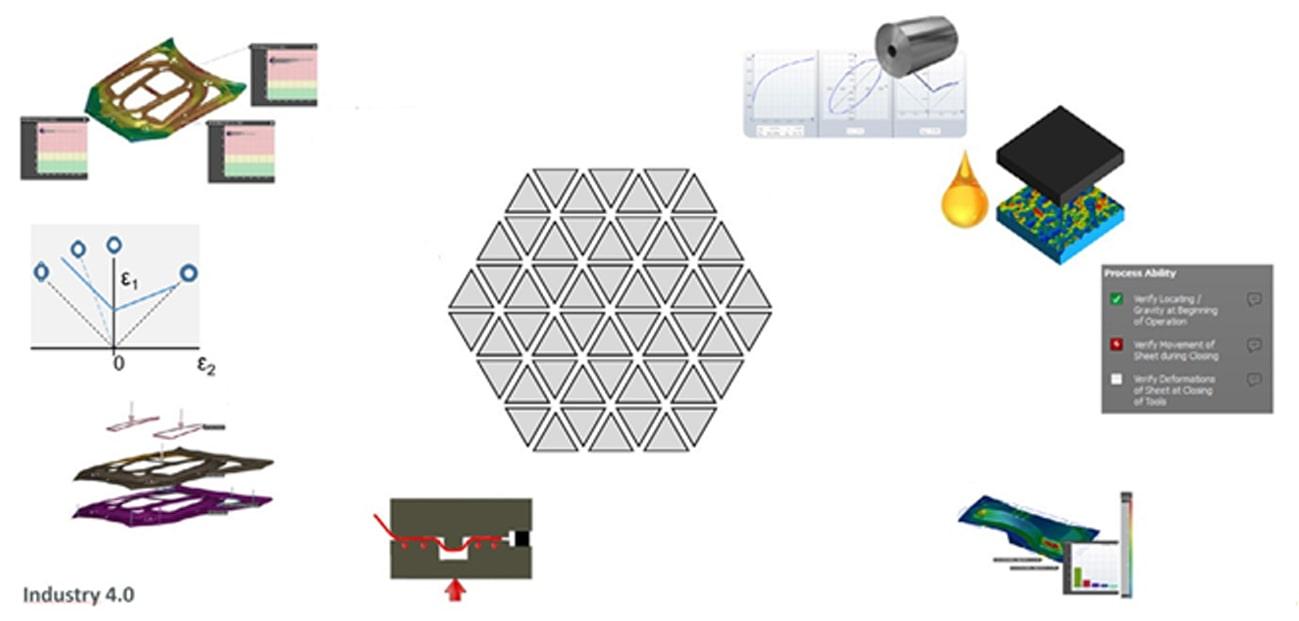
Figure 4: Accuracy footprint
The creation of the Master Digital Process Twin involves several steps and considers multiple topics and parameters that must be taken into consideration for its correct application.
For this purpose, we launched two topics, shown in Figures 4 and 5, that exemplify the caution inherent in creating a reliable Digital Master.
The first, illustrated in Figure 4, refers to the Accuracy Footprint, which represents the various topics to be considered when creating a digital twin that represents reality and can be replicated in practice. The figure only presents the topics superficially, as each could be the subject of its own paper.
The second topic, illustrated in Figure 5,
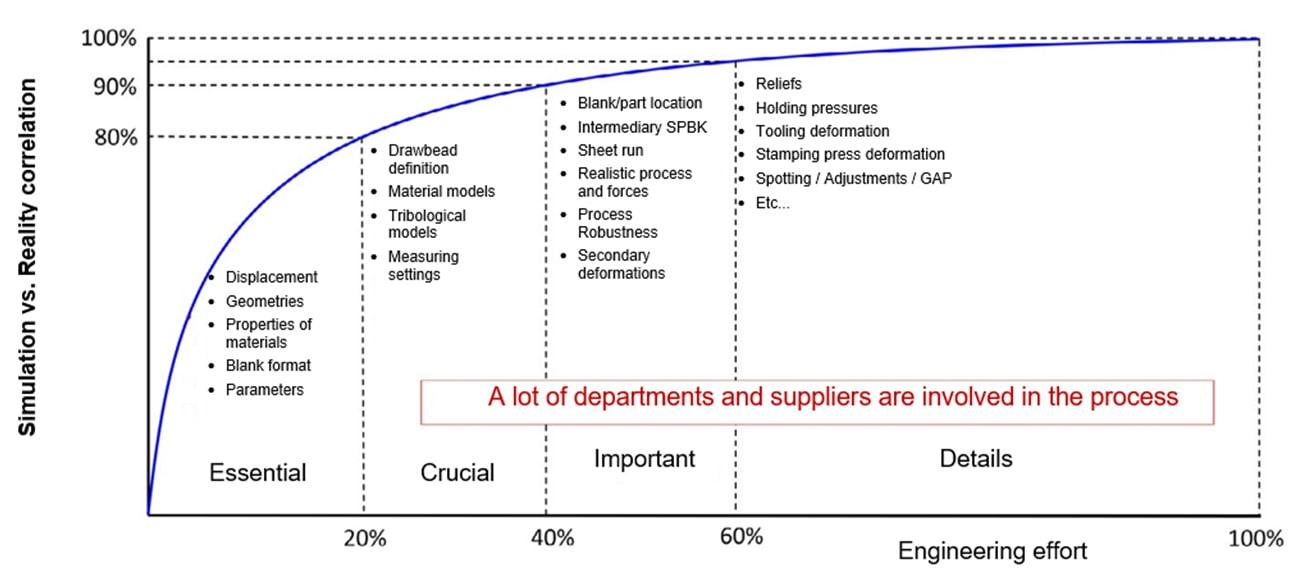
Figure 5: Pareto
aims to demonstrate the engineering effort required to obtain a digital model that matches the reality in the proposed field of study (i.e., sheet metal forming process).
The graph shown illustrates the relationship between the engineering effort (time spent) and the gain in predictive capability, ranging from simple wrinkle and rupture analysis to the complex prediction of springback and aesthetic defects visible to the naked eye. The creation of digital models aims only to provide information that is accurate and precise enough to allow corrections to be made in the virtual world, eliminating the subjectivity of the process. Once a reliable Digital Master has been achieved, that is, one whose predictability of physical results is high enough to approve a process, we then encounter a challenge: how do we achieve the results of the Master Digital in the tool shop (real world)?
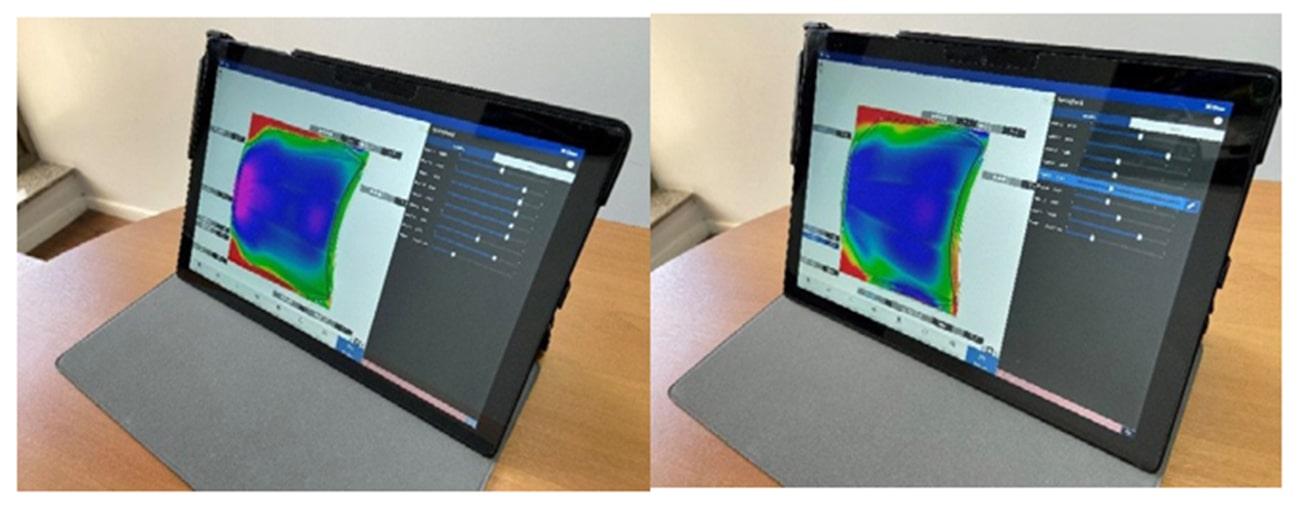
Figure 6: Springback results as a function of geometry changes in the drawbead
To accomplish this, information exchange and an integrated platform are indispensable. Departments need to be in consistent communication, which is facilitated by two powerful tools: Tryout Map and Production Map. The difference between them is the timing at which they’re applied, however, both have the same objective: to provide the information necessary to create in practice what was outlined in the Digital Master.
For instance, the Tryout Map contains information to predict what will happen in the tool shop by considering multiple scenarios that may not be under the operator’s control, such as: material mechanical property variations, pad and blankholder force variations, different tribological conditions, etc.
Besides this, the Tryout Map allows the operator to predict the result of any modifications to the tool. For example, identifying the impact of a dimensional change in a drawbead on the springback of the part, as shown in Figure 6.
This enables a drastic reduction in tool adjustment time. If the Tryout Map identifies that the change will be harmful to the process/tool, it is simply not executed and only those alterations with high potential to solve the problem are adopted and implemented, reducing expenses and time spent reworking.
Figure 7 shows the digitalization phases of industrial processes in a simplified way. Currently, the majority of the Brazilian industry is
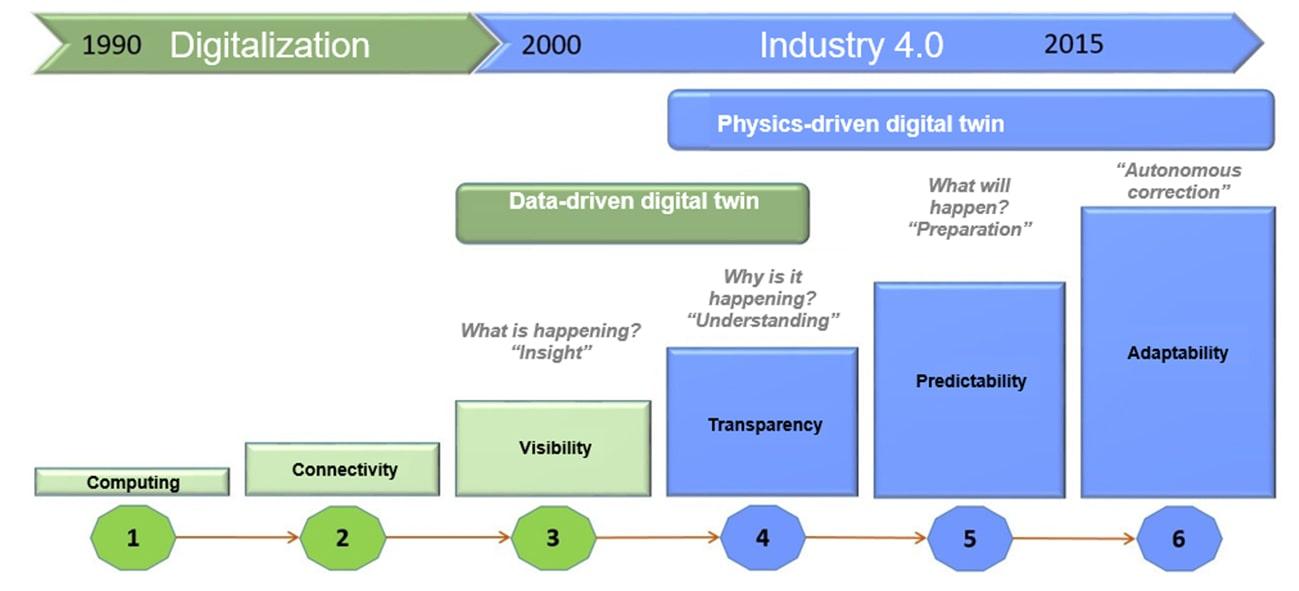
Figure 7: Digitization phases
in stage 4, where occurs an “understanding” of what can be done, what is needed to make it happen, and how it will be done. The Tryout Map and the Production Map are both part of stage 5 — generating information about what will happen, so we can then take action to fix the deviations.
There is helpful software that can assist in the creation of Tryout Maps and Production Maps. This software makes it possible to jump from deterministic computational simulation (i.e., having a set of fixed contour conditions and providing the result prediction for these specific conditions) to stochastic computational analysis, which allows for a process robustness study.
In these analyses, the user defines ranges for the contour conditions, upon which the software runs statistical combinations and generates a number n of iterations that are calculated separately in parallel and then compiled into a unique file. Once completed, this file delivers results for multiple initial scenarios. Thus, the user can learn what actions need to be taken based on the given scenario when the tryout starts (Tryout Map), or when a production issue occurs (Production Map).
The future: Adaptability and Industry 4.0
By using stochastic analysis, which generates a huge quantity of information compiled and post-processed using the statistical tools available in the software, it is possible to predict the results of different initial conditions for the stamping process — including variations out of direct production control (material properties, sheet roughness, sheet thickness, etc.) as well as the effects of process parameters that can be controlled (holder force, blank geometry and position, quantity of lubricating oil, etc.). As a result, the digital twin allows you to predict the possible stamping issues that can arise due to variations in certain measurable factors, as well as to indicate the solutions to these issues through process parameter adjustments.
Stage 6 of the flow chart presented in Figure 7 (Adaptability) represents the not-too-distant future. The idea is to establish entirely sensor-based digital factories, where, using the information obtained in stochastic simulations, the factory becomes adaptable, automatically correcting the production process adjustments. This means it can absorb the process variations and noises, reducing the down time to a minimum and consequently increasing the production efficiency.
Figure 8 below illustrates this scenario. Problems appear in production thanks to the fluctuation in the noise variables. But the stochastic features of the simulations mean the adjustments to correct the issue can be tested on the digital twin
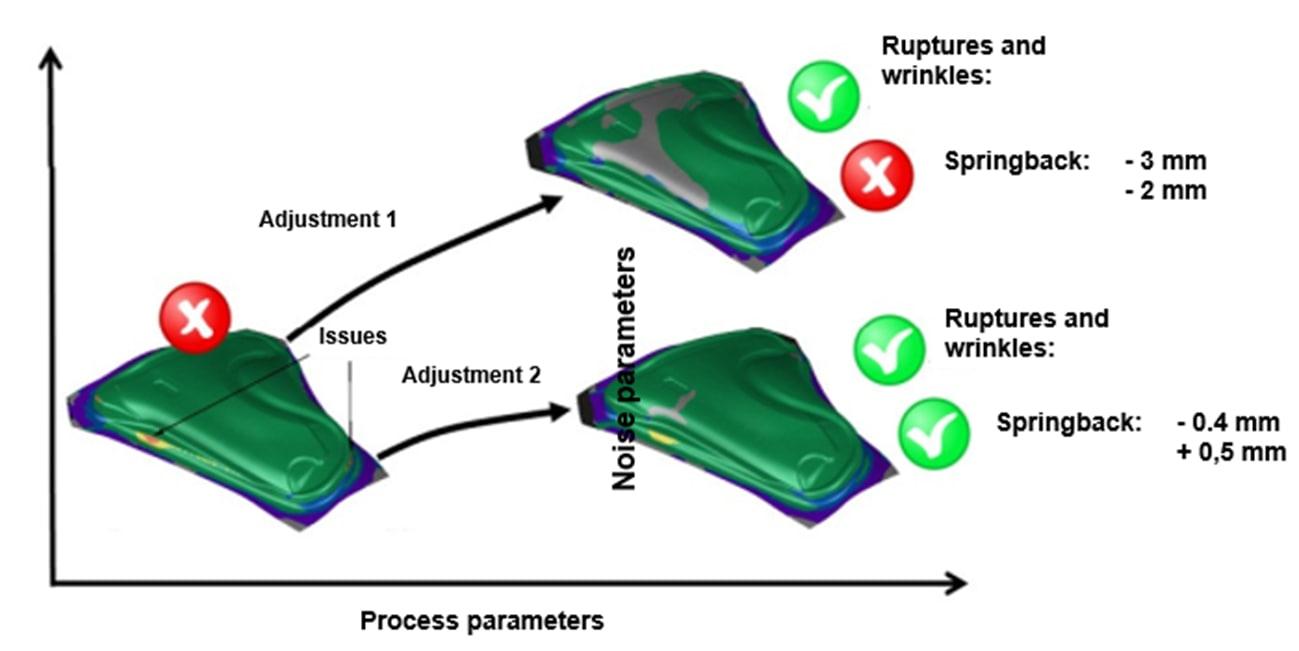
Figure 8: Process adjustment using a digital twin with stochastic simulations
until a solution is found. And only then will it be applied to the real production line with the assurance of a positive result. Automation enables issues to be automatically detected even before they occur in practice, and the process adjustment to be carried out without requiring human intervention.
Conclusion: What is currently available?
In Stuttgart, Germany, the company Schuler already works with the Smart Press Shop in real tests, implementing the Digital Twin and Industry 4.0 concepts — a fully integrated and sensor-equipped factory capable of predicting and adapting to process changes.
In Brazil, we have the technology to proceed to stage 5 (Figure 7), covering a large part of the digitization cycle. As a result, we are already achieving impressive gains regarding the reduction of down time and scraping in the production of metal panels and preparing us for future stages. With specific computer simulation software like AutoForm®, it is estimated that every BRL 1.00 invested in development phases brings a return in savings higher than BRL 10.00, i.e., an ROI ratio greater than 10 times (based on reports from customers around the globe). That is achieved without even mentioning the complete digitalization of the process, just predicting results, mapping scenarios, and making decisions based on the information provided by the analyses mentioned in this paper.
Authors:
César Augusto Batalha — General Manager of AutoForm do Brasil, responsible for operations, technical support and sales for the entire national territory and for technical and commercial support to the Argentine market. With over 25 years of experience in the automotive industry in the fields of body parts and automation related to engineering, manufacturing, project management and deployment. +55 11 4122-6778 / cesar.batalha@autoform.com.br
Leandro Guimarães Cardoso — Mechanical Engineer graduated from the University of Brasilia with postgraduate degree in structural analysis using the Finite Element Method at the UFRJ-COPPE. With 30 years of experience in the fields of product development engineering, deployment of CAD/CAE/CAM systems, structural analysis, simulation of manufacturing processes and discrete production lines, having personally used and supervised the deployment and application of these technologies in several companies from the automotive, auto parts and other sectors. He currently works at AutoForm do Brasil as Technical Area Supervisor, responsible for pre-sales activities, training and technical support to users of the company’s programs. +55 11 4121-1644 / leandro.cardoso@autoform.com.br
Fernando Henrique Tersetti — Application Engineer at AutoForm do Brasil and member of the technical team responsible for supporting the software application in the Brazilian and Argentine markets. With 10 years of experience in the automotive industry, working in the fields of stamping tool design and stamping process simulation. He holds an undergraduate degree in Control and Automation Engineering and an MBA in Project Management. +55 11 4122-6779 / fernando.tersetti@autoform.com.br


?")


