
It is well known that tool makers really struggle in creating a material card that describes material behavior under deformation made by the stamping process. Most of the time they end up using equivalent material card or a card created by using very limited amount of data (and use generic assumptions). In this article Ramandeep Singh, AutoForm Technical Account Manager India, explains how considering material scattering can support engineering delivering reliable data to tool shops
Over the last few decades, simulation software has become standard practice for virtually validating the stamping process. To ensure correspondence between digital and real-time manufacturing, the material card used in the stamping simulation is a crucial input.
Toolmakers often encounter difficulties during tool tryouts when working with limited material information during process engineering – process simulation. These challenges often arise when toolmakers receive the project from the OEM supply chain department, who may not fully understand the importance of material characterization in stamping process engineering (simulation). When toolmakers are given the project data and part design, they receive either a test certificate of the part material or just the material grade name. The test certificate (Fig. 1) typically contains only a few material parameters, such as yield stress (σy – YP), ultimate tensile strength (TS), total elongation, and single r-value (anisotropy). However, these data are not sufficient to create an accurate material card that describes the material’s arbitrary stress-state behavior under deformation. As a result, toolmakers often have to chase OEMs to obtain the necessary material parameters, as the project timeline does not allow for delay.
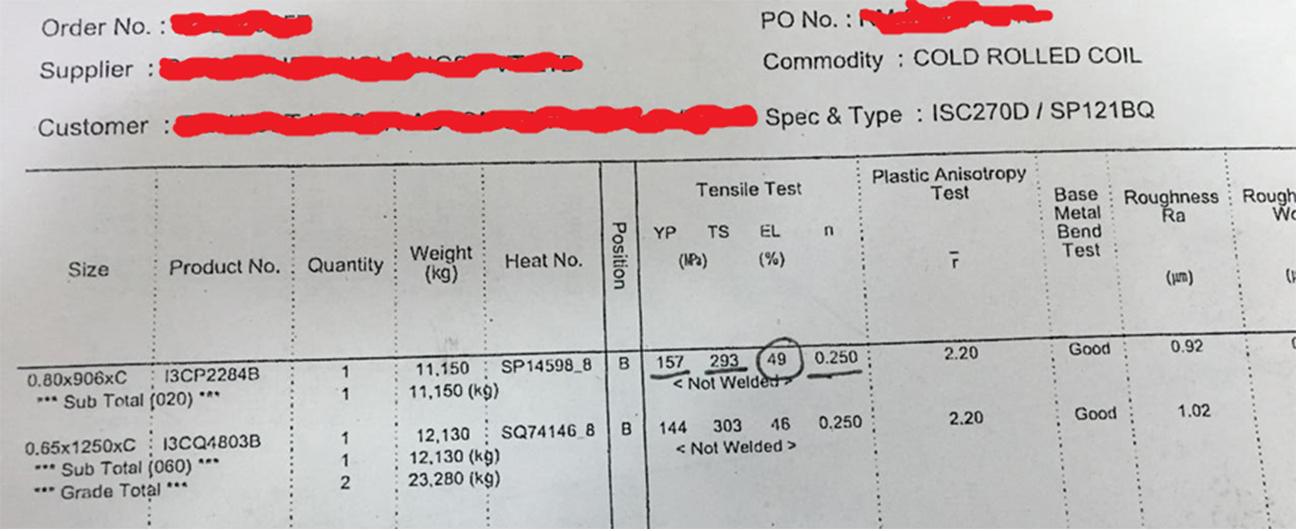
Fig. 1 – Testing certificate (TC) received by toolmaker
A toolmaker from India faced a similar scenario in which they generated a material card (Fig. 2) based on the parameters specified in the test certificate provided by the customer (Fig.1). Although the material card has limited number of parameters in the test certificate, the toolmaker had no alternative but to use it for the initial engineering simulation phase. The toolmaker tried to gather additional information to create a more accurate material card as the engineering process progressed, but was ultimately unsuccessful, needing to rely on incomplete data to meet the project deadline. The engineering department released the simulation data for final tool manufacturing with the hope that everything would run smoothly during tryout.
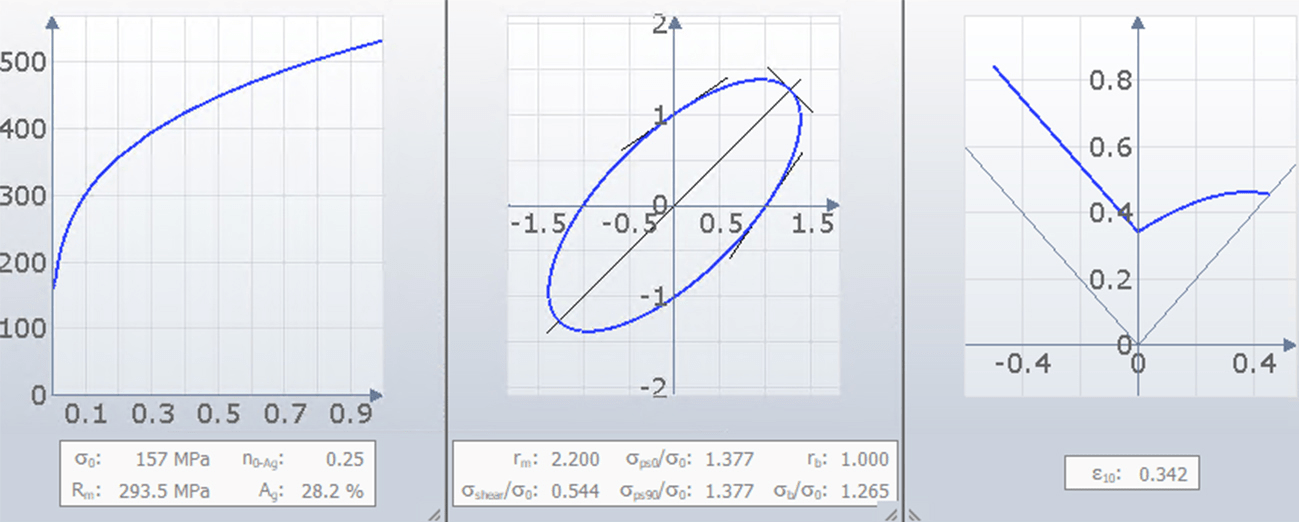
Fig. 2: Material card curves built with some “assumptions” and used in simulation
Unfortunately, things did not go as wished for the toolmaker. During the tryout, they encountered a large crack in the panel (Fig. 3), which was unexpected according to the results of the simulation from the engineering phase.
When issues like this occur, the engineering team is usually the first guilty party, and the tryout process becomes a form of re-engineering the die. Although there can be many reasons for the differences between reality and simulation, modifying the die is often seen as the quickest solution, since the tools must be fixed regardless. However, this approach often overlooks the possibility that the problem may have been caused by process issues or incorrect input values, and checking material parameters is often difficult and costly.
To help the tryout team with troubleshooting the die and the process, engineering could have performed a stability and robustness evaluation, along with a sensitivity analysis. This would have provided valuable information about the cause of the splits. In this case, the material card used in simulation did not account for variations in the material properties. Material variation in production can be a significant issue and robustness analysis can help identify the potential impact of such variations. But before moving on to robustness analysis, it is important to ensure that the material card used in simulation is error free and as close as possible to the real experimental data provided by material supplier testing.
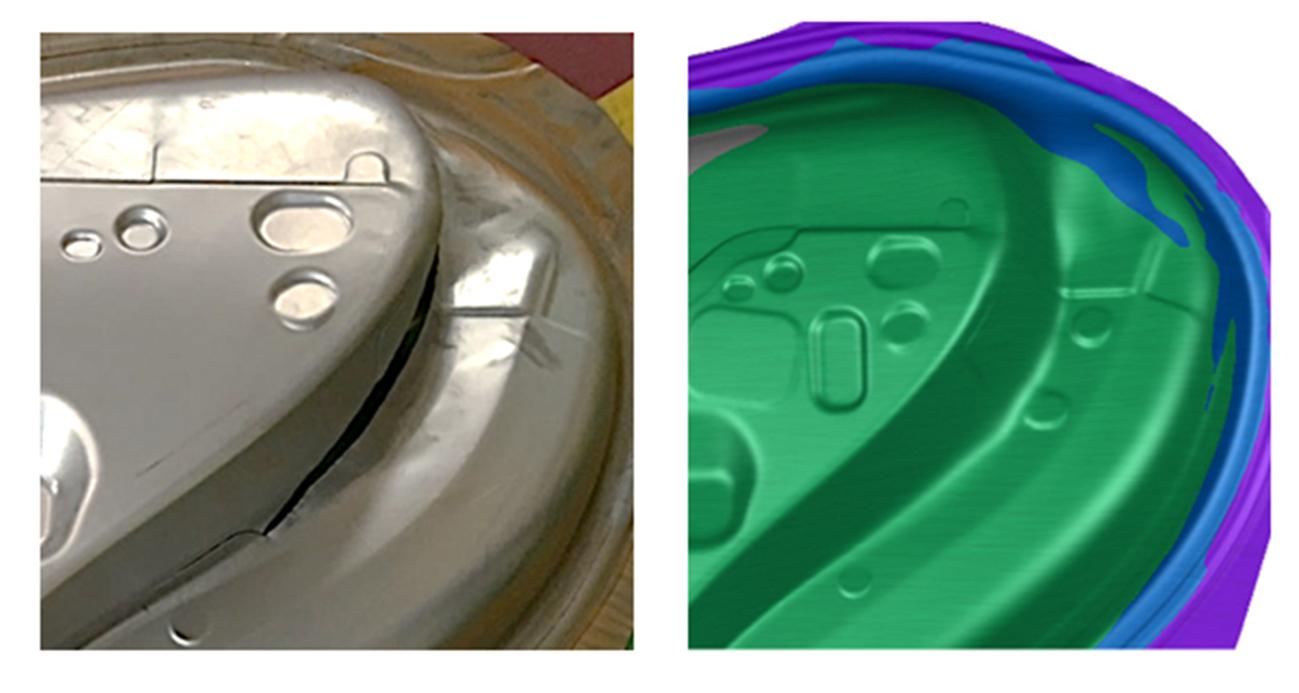
Fig. 3: Tryout outcome vs simulation results
What are the right parameters to use? Different types of experiments are involved in material characterization testing, which provide both real experimental data and single material parameters such as yield stress σy , ultimate strength, n-value, etc. There is no doubt that real experimental data provide greater accuracy for a material card than material parameters. However, it is very rare for toolmakers to receive real data representing the requisite material. Along with the right parameters, it is critical to consider the unavoidable material variation from coil to coil. The given test certificate provides the following value: σy= 157Mpa, UTS= 293Mpa and r =2.2; but what if these parameters vary by +/- 10-20% during the material production process?
Let’s check the two simulation results below; the left simulation ran at -10% variation and the right +10% from base parameters. As a result, the left side indicates heavy splits whereas the right is completely green.
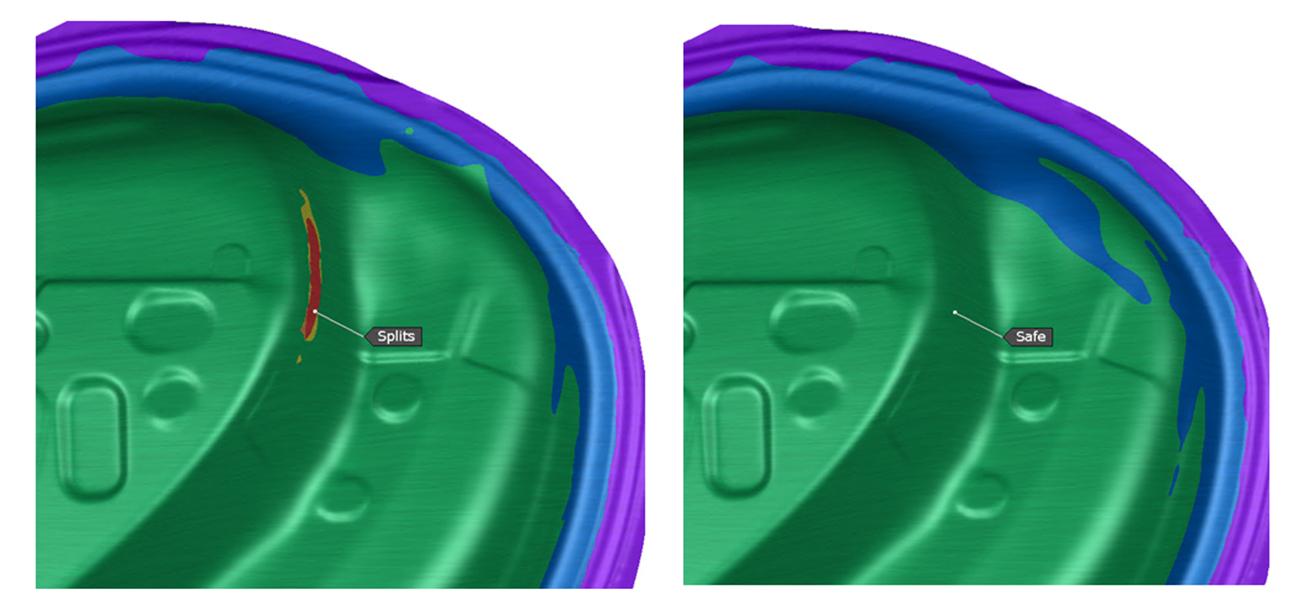
Fig. 4: Formability check — material lower limit (left) vs material upper limit (right) results
Now imagine you are the toolmaker, which results you should rely on for the final validation? Toolmakers need a solution to help check the process window for part quality with respect to material variation during tryout or production. Robustness analysis is useful here, as it evaluates all possible material combinations/variations according to the specifications. Fig. 5 illustrates the potential variations in the material parameters.

Fig. 5: Representation of material parameters with noise variation
The FLD diagram generated by the robustness analysis shows that the part failed. The hull part crossed the FLC line, meaning there is a combination of parameters that can generate splits. To further evaluate these splits, we should analyze the thinning of the part in relation to its specification limits.
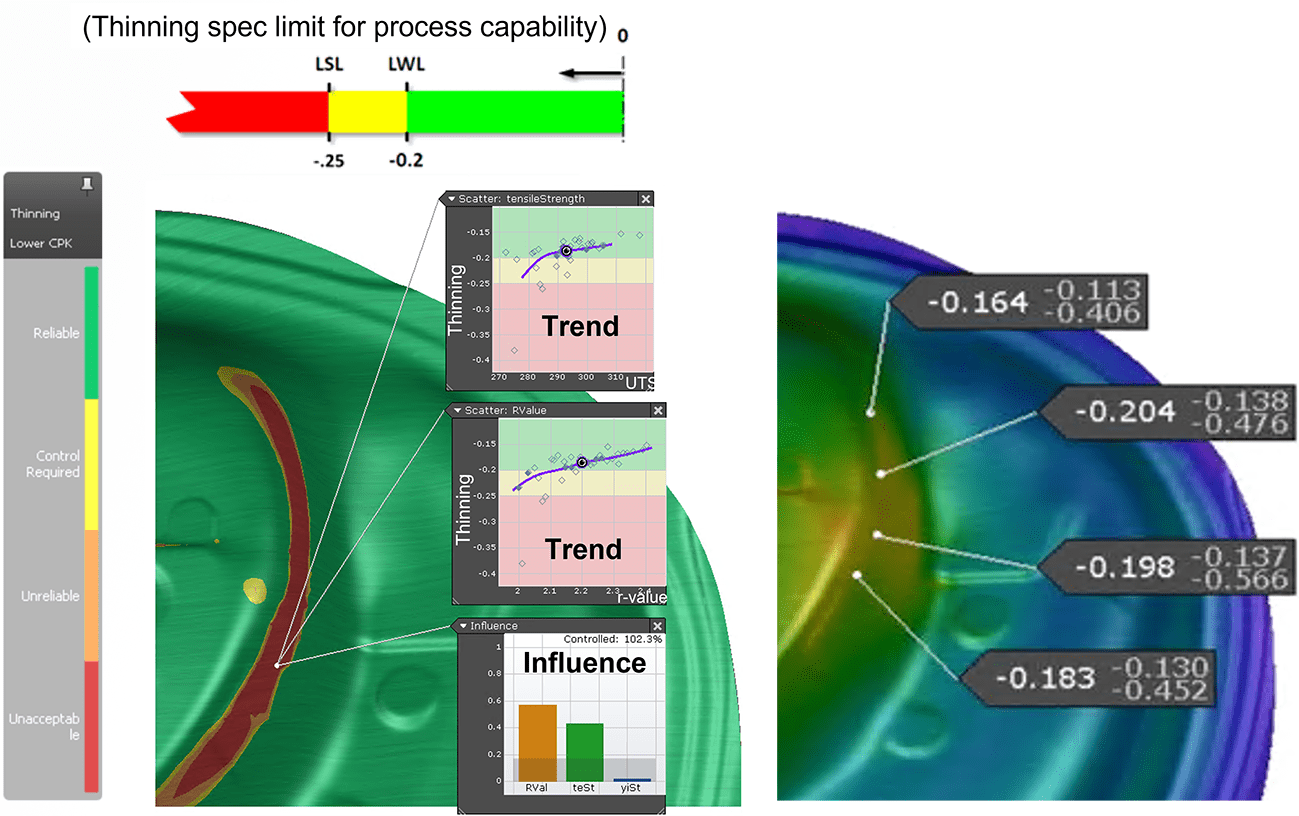 Fig. 6: Process capability (Cpk) of thinning with spec limits and thinning variation (Click image to enlarge)
The part is very sensitive to r-value (isotropy) and ultimate tensile strength, as shown in the influence plot in Fig. 6. The scatter plot also illustrates that if the material has a lower r-value and UTS value, it is likely to fail the spec limit for thinning. Fig. 6 (right) demonstrates that thinning can reach up to 56% in some areas due to noise variations in the material.
Running a robustness analysis with possible variations during the engineering phase can help to identify and fix problems such as splits in the die before it reaches tryout. This can save time and money by avoiding issues in production, which can be costly and cause delays. Simulations that consider only a single set of material parameters cannot account for tryout or production variation, which is essential to ensure a robust and reliable design.
Conclusions
- The accuracy of simulation results, which process engineers rely on to make decisions and provide data to tool manufacturers, depends on the reliability of the input data.
- Input data in stamping processes is not constant. Material characteristics can vary with each coil and may be influenced by the production process, which itself may have variability. Quality departments often evaluate the capabilities of the production process to ensure consistent results.
- In addition to input data, other variables must be considered in stamping, including oil viscosity, temperature, roughness of tools and blanks, and pressure on the binder. Validating only one set of parameters (which we get from one process simulation) is insufficient to validate the production process. It is necessary to simulate the entire production process and not just one stroke of the press, as it is designed to produce a large quantity of pieces, and not just a few.
- To ensure the reliability of the production process, it is necessary to check the stability and repeatability of simulation results under actual production conditions, taking into account the variability of all process parameters. This is the only way to accurately validate the production process.


?")


