
How AutoForm Ran the Gauntlet at the 2016 Numisheet Conference
Looking back at the 10th international conference and workshop on numerical simulation of 3D sheet metal forming processes (Numisheet) held on 4-9 September 2016 in Bristol, UK, AutoForm won a benchmark test for springback prediction after warmforming of an aluminum cup. What was never told, however, was the fact that AutoForm won this benchmark on its’, then untested, beta-software version. Seeing the industrial benchmark sessions are the most distinguishing features of this conference we’ve decided to tell the full story. Alper Güner, AutoForm Technical Product Manager, relates what happened.
In those sessions, organizers place a benchmark plan allowing experts to perform forming tests. This benchmark was about prediction of springback after warm forming of the aluminum alloy AA5086-H111. The selected geometry was a cylindrical cup with 0.8 mm thickness. The material characterization results, tool geometries and process conditions are shared before the conference.
At that time our customers were using AutoForm-R6. I had access to AutoForm-R7, but in its beta-version which would be tested in upcoming months. The development of the new hot forming feature “3D heat conduction in tools,” including its modelling of the cooling channels, had only just been finished and I really wanted to try this new feature. Moreover, the temperature dependent r-values had been introduced. Luckily, the Numisheet benchmark was a perfect opportunity to test these new functionalities since at the end, the accuracy of the simulations would be quantified during the conference. At the beginning, we were not planning to submit the results officially since we found this pre-release version experiment somewhat risky, but after we ran the simulations, we had gained more confidence in our new implementation so that finally we decided to submit our results to participate in the benchmark.
Typically, benchmark participants wanting to take part use the given inputs and perform numerical simulations using their own modelling strategy. They then submit the results of simulations to the organizers without knowing the experimental results. Of course, entering with untested software made it more exciting. Experimental measurements and numerical results of the participants are published during the conference. Afterwards, it is possible to compare different software, element formulations and material models. Naturally this sets a vibrant buzzing scene as the results are announced and we were elated by the results.
The benchmark experiments were performed at three temperatures: 25 °C, 150 °C and 240 °C. The blanks were heated between the die and blankholder to the desired temperature. The punch is not heated and due to this contact the sheet loses heat continuously during deep drawing. Ring opening tests were performed on the deepdrawn cups. In addition to this, earing and thickness profiles, temperature profile of the sheet and the tools and punch forces were recorded. These measures were to be submitted by the benchmark participants. The sheet material was characterized by the benchmark committee in the mentioned temperatures at three different strain rates.
Regarding the modeling of this problem, there were three main challenges:
- Material modeling: The characterization results showed that flow stress is temperature and strain rate dependent. Moreover, r-values of the sheet were also found to be temperature dependent with a maximum deviation of 15 %. This means that the definition of the yield locus or anisotropy is also temperature dependent.
- Process conditions: Since the whole material behavior is temperature dependent, heat transfer in the whole system (in the sheet, between the sheet and tools, to the ambient) plays a crucial role in the quality of numerical results. 3D heat conduction was used for the tools.
- Thermal parameters: The main governing parameter regarding the temperature of the sheet is the heat transfer coefficient (HTC) between tools and the sheet. This parameter was not identified by the benchmark committee and therefore should be obtained by inverse parameter identification.
The operations of our simulations can be seen in the below figure. The modeled sequence here is exactly the same as the one used in the experiments. Springback is considered at the end of drawing operations, during cooling and after the trim operations. The ring opening at the end is the main parameter and focus of the benchmark.
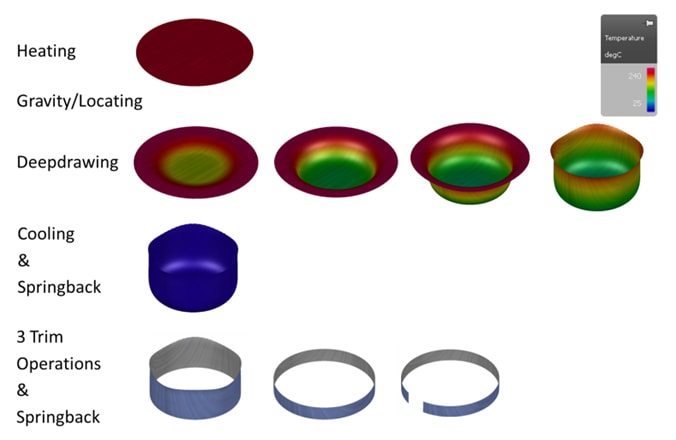
Fig. 1: Mechanical and thermal operations from heating to final ring opening
Temperature and strain rate dependent flow curves are used in order to accurately model the sheet metal behavior. Moreover, the r-values are also defined temperature dependent. This leads to an evolution of anisotropy of the material as a function of temperature. The corresponding material card was generated and used for all temperature ranges. The important details of the model are summarized in the following table:
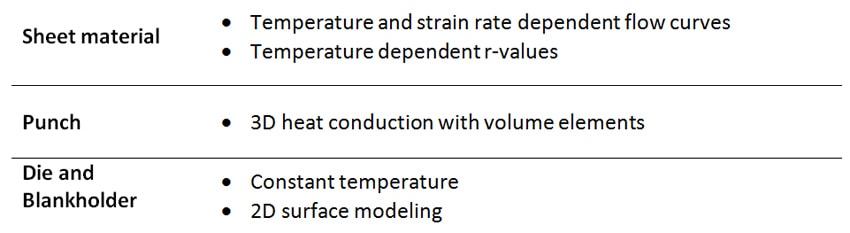
Table 1 Details of the finite element model
Obviously, we were very excited about the quality of our results. After submitting our numerical results, we waited about three months until the conference date. I will never forget the moment that I first saw our results. Upon arriving I registered for the conference at the registration desk and was given the conference proceedings, including the benchmark booklet. I immediately flipped over to the pages with our results. What a huge relief it was to see that our results were one of the best submissions. It was also interesting to see that not many software houses had dared to submit their own results for all the witness. I entered the conference not knowing we had won.
Our submission (see figure below) was officially announced as the winner of the benchmark in front of all gathered participants. We were also asked to give a speech in the benchmark session on our modelling strategy. About six months later the finished software was released to the public and the 3D heat conduction in tools has since become a key feature in hot forming simulations.
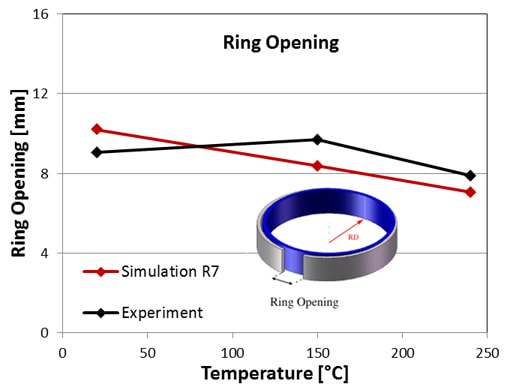
Fig. 2 Comparison of the Winning Simulation vs. the Experiment
Dr. Alper Güner
Technical Product Manager, AutoForm
Sign up to our blog to stay informed. We’ll never send any marketing emails. You’ll receive a once per month update of our top posts.


?")


