
Authors: José Eduardo Zanon, Aquiles da Silva Schauenberg, Elenon Cunha, Jonas Adão Linn (Bruning Tecnometal) & Luis Augusto Castilho Valdo (AutoForm do Brasil)
The year was 1999, when the movie The Matrix was released, presenting an innovative narrative that challenged the very notion of reality as we knew it. The plot revolves around Neo, a hacker who discovers that the world he lives in is a virtual simulation controlled by machines. The film captivated audiences and sparked deep reflections on perception, freedom, and the purpose of human existence.
Nearly three decades later, the concept of digital twins has continued to gain strength as a promising and long-term technology, with the potential to transform multiple sectors of industry and society. At first glance, the connection between The Matrix and digital twins may not be immediately apparent. However, when examining the essence of the simulation depicted in the film, as shown in Figure 1, interesting and meaningful parallels with digital twin technology begin to emerge.

Figure 1 – Virtual simulations in The Matrix
Despite serving very different purposes, both the simulation in The Matrix and digital twin simulations share a common objective: understanding and influencing reality. In the film, machines use simulation to control humans. In industrial applications, humans use simulation to control, optimize, and improve real machines and processes.
In one of the most striking moments of the film, Neo must choose between the blue pill, which allows him to remain within the comfort of the simulated world, and the red pill, which reveals an unfamiliar reality filled with new possibilities (see Figure 2). This choice echoes in today’s industrial environment, where the decision to adopt or reject new technologies can define the future of a company or keep it anchored in familiar territory.

Figure 2 – “All I’m offering is the truth, nothing more.” Classic scene from The Matrix showing the blue pill and red pill choice.
Just as Neo chose to change and experience a new reality, companies seeking excellence cannot remain satisfied with the perceived security of traditional methods. Ignoring the potential of digital twins and simulations is comparable to choosing the blue pill, accepting the limitations of experimental approaches with their associated risks of errors, rework, and low efficiency. Simulation, on the other hand, represents the red pill of industry: an opportunity to explore new possibilities, optimize processes, anticipate failures, and reach higher levels of efficiency and competitiveness.
This is not about abandoning practical experience, but rather about complementing it with the virtual support provided by simulation. Digital twins function as detailed maps that guide the production journey, allowing challenges to be anticipated and better paths to be identified. Just as Neo freed himself from the Matrix, companies that embrace simulation and digital twins can free themselves from the constraints of purely experimental approaches, gaining greater control and long-term success.
In other words, a smart and innovative manufacturing environment depends directly on the technologies applied and on how they are managed. Today, several software solutions are available to support product planning, as well as equipment and process development.
In Body-in-White development, projects typically move through product development, process development, process validation, tryout, and production. Currently, simulation software can support all of these stages of the production chain, as well as additional subprocesses not explicitly mentioned, whether handled internally or together with suppliers.
In the field of product development, software tools allow the evaluation and quantification of accumulated geometric tolerance variations. These tools make it possible to study tolerance effects within the context of component assemblies, identifying where dimensional deviations will or will not impact the final assembly. An example is shown in Figure 3.
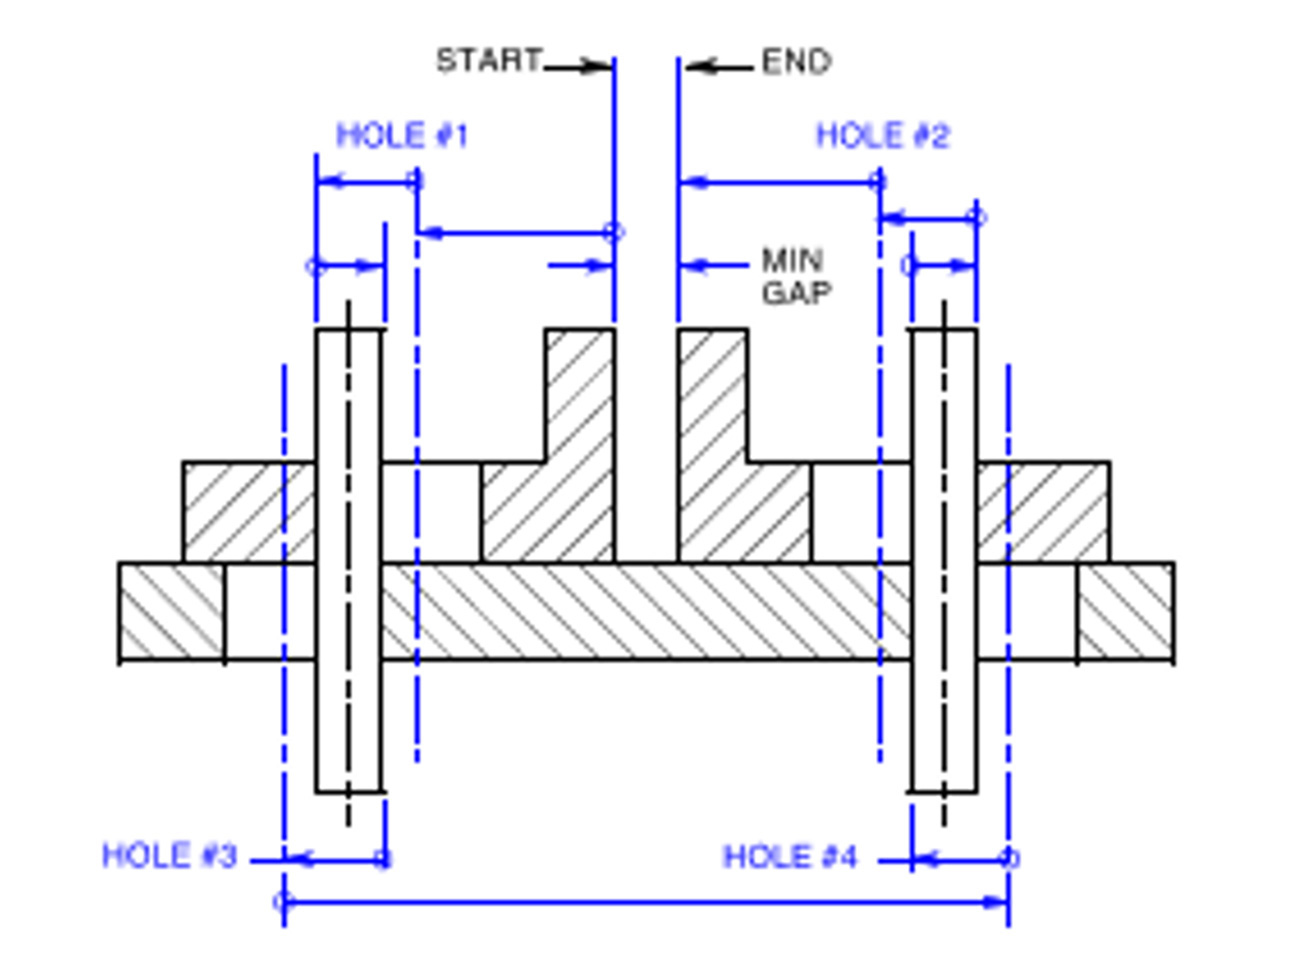
Figure 3 – Example of 2D tolerance stack analysis
In process development, another solution that has existed for some time is kinematic or manufacturing simulation. These simulations serve various purposes, such as access studies, sequencing, Takt Time analysis, kinematic positioning, and even robot and electromechanical peripheral programming. In these studies, the movements of operators, actuators, handling grippers, accumulation conveyors, rotary tables, and access doors are analyzed, as shown in Figure 4.
Modern software also simulates human production movements, known as MTM, or Methods-Time Measurement. Before the availability of this technology, MTM calculations relied on extensive tables and specialized training. These methods allowed process engineers to determine cycle times, size production cells and lines, and define the required number of robots and buffers to ensure continuous production that meets market or customer demand.
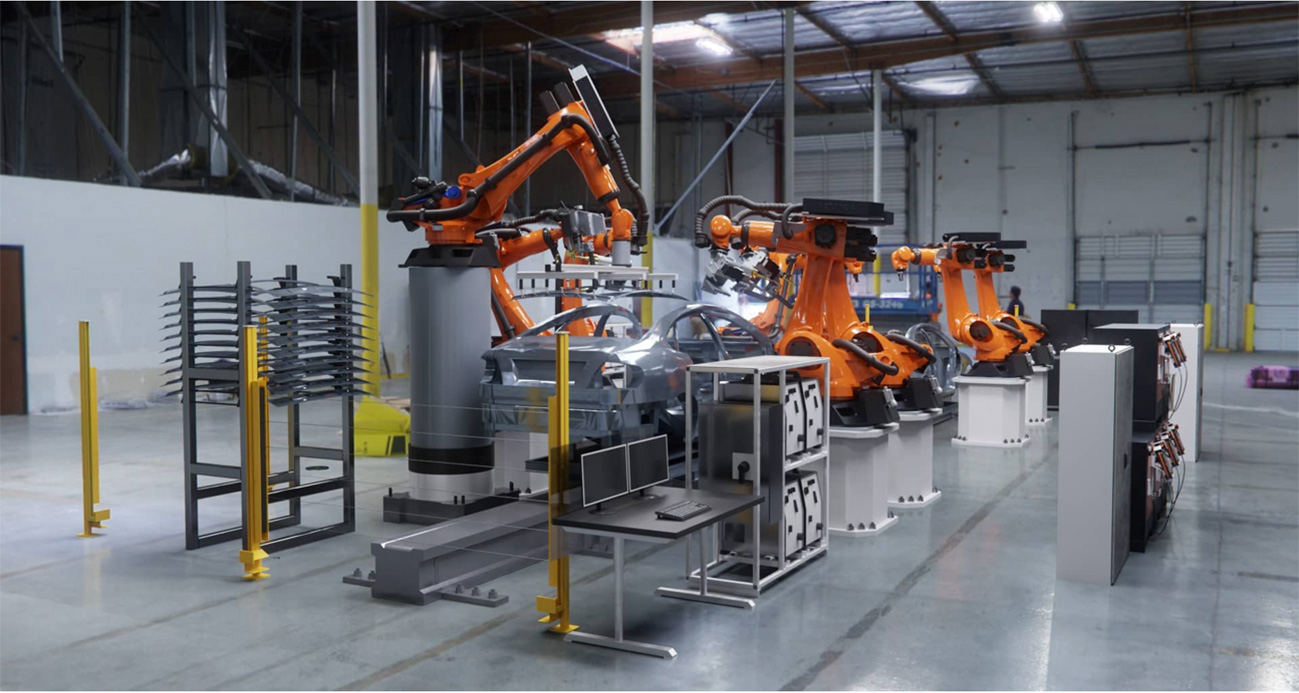
Figure 4 – Kinematic or manufacturing simulations
The solutions described above complement each other and allow a more complete analysis of the production process, combining GD&T considerations with production line sizing. However, an additional need remains: the simulation of the dimensional behavior of assemblies influenced by joining processes such as welding and hemming. In this study, the focus is on resistance spot welding.
Since 2021, these processes can also be simulated through AutoForm Assembly, shown in Figure 5. This technology allows digital validation of production processes, with a focus on dimensional optimization and product quality. It supports both internal and external stakeholders in Body-in-White assembly lines, as well as Tier 1 and Tier 2 suppliers, enabling the entire production chain to validate processes virtually and significantly reduce Tryout time. It also allows feedback to stamping processes related to assembled parts.
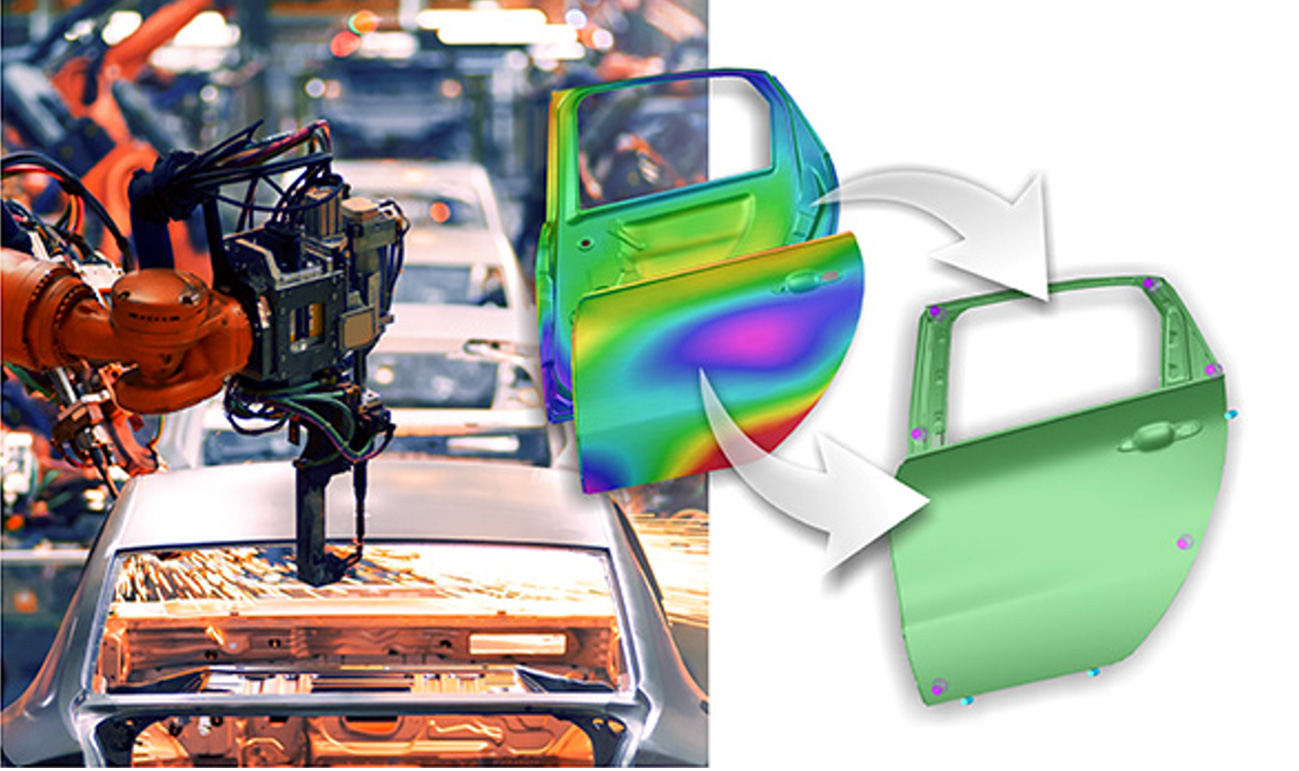
Figure 5 – AutoForm Assembly software
Bruning Tecnometal has used AutoForm solutions in its service portfolio since before 2011, creating a strong competitive advantage in the manufacturing market. Founded in Panambi in 1947, Bruning Tecnometal operates in the metalworking sector across agricultural, automotive, road, and construction segments. The company plans, produces, and delivers components using stamping, machining, welding, surface treatment, painting, and tooling processes for major automakers in Brazil and abroad.
Quality, punctuality, robust process technologies, and skilled people are the foundations of Bruning Tecnometal’s future. Located in Rio Grande do Sul, the company’s facility is shown in Figure 6. Building on the strong results achieved with AutoForm Forming, Bruning began testing AutoForm Assembly in 2024. Through the work of Aquiles da Silva Schauenberg and José Eduardo Zanon, an effective application was developed that connects the various software solutions mentioned above, allowing a comprehensive virtual simulation of the production process.
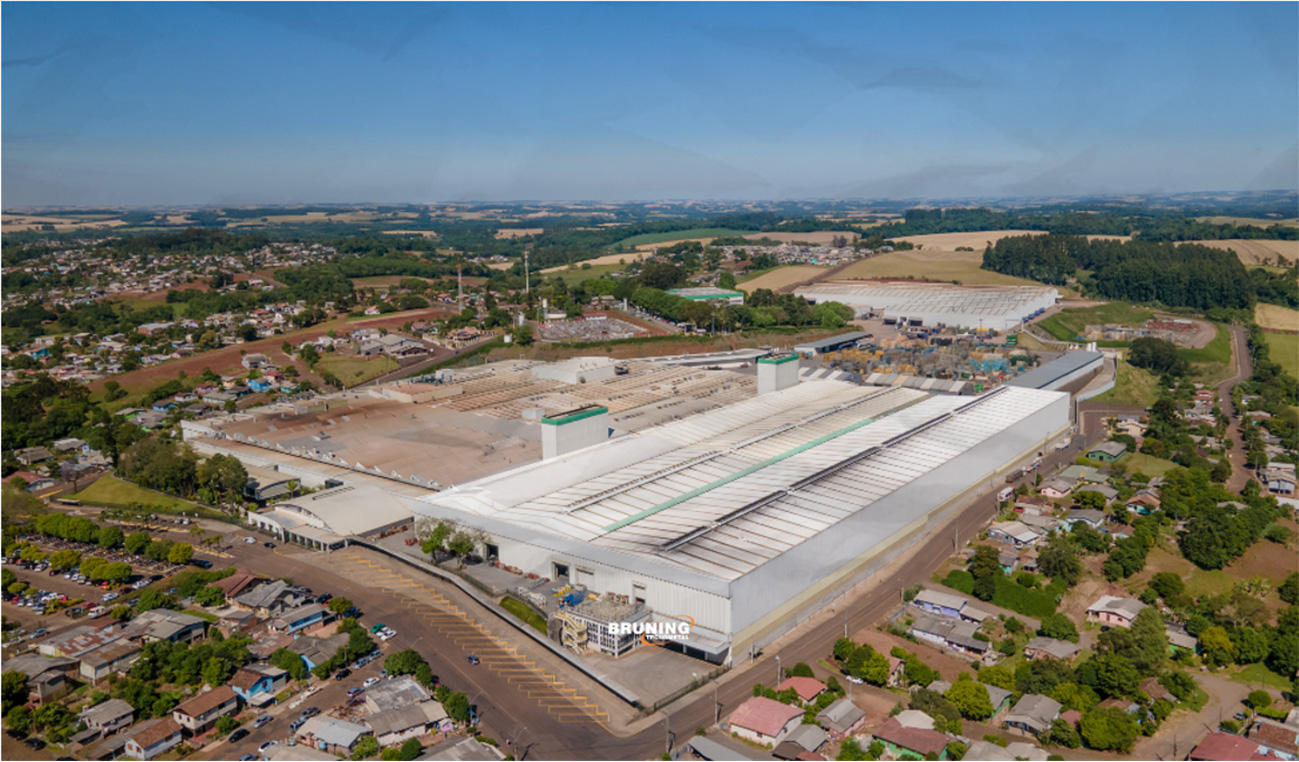
Figure 6 – Bruning facility in Panambi, Rio Grande do Sul, Brazil
This article presents a scenario focused on optimizing a resistance spot welding process, with the goal of reducing Takt Time without compromising dimensional quality. Due to confidentiality agreements, end customers are not disclosed, and part geometries have been protected.
The study addresses the optimization of a structural assembly for a heavy-duty vehicle. Its motivation lies in the need to improve dimensional accuracy in two critical regions that were outside tolerance, as well as the opportunity to reduce the Takt Time of the production cell. The study was therefore divided into two stages, first focusing on welding sequence optimization and then on variations in the positioning of welding fixture clamps. Based on the results, a new process proposal could be validated.
The process includes three welding stations. The first two involve resistance spot welding, referred to as tables 1 and 2, followed by MAG welding at table 3, as shown in Figure 7. The scope of this study is limited to the optimization of resistance spot welding sequencing.
At the start of the study, the combined Takt Time for tables 1 and 2 was approximately 5.31 minutes, as shown in Figure 7.
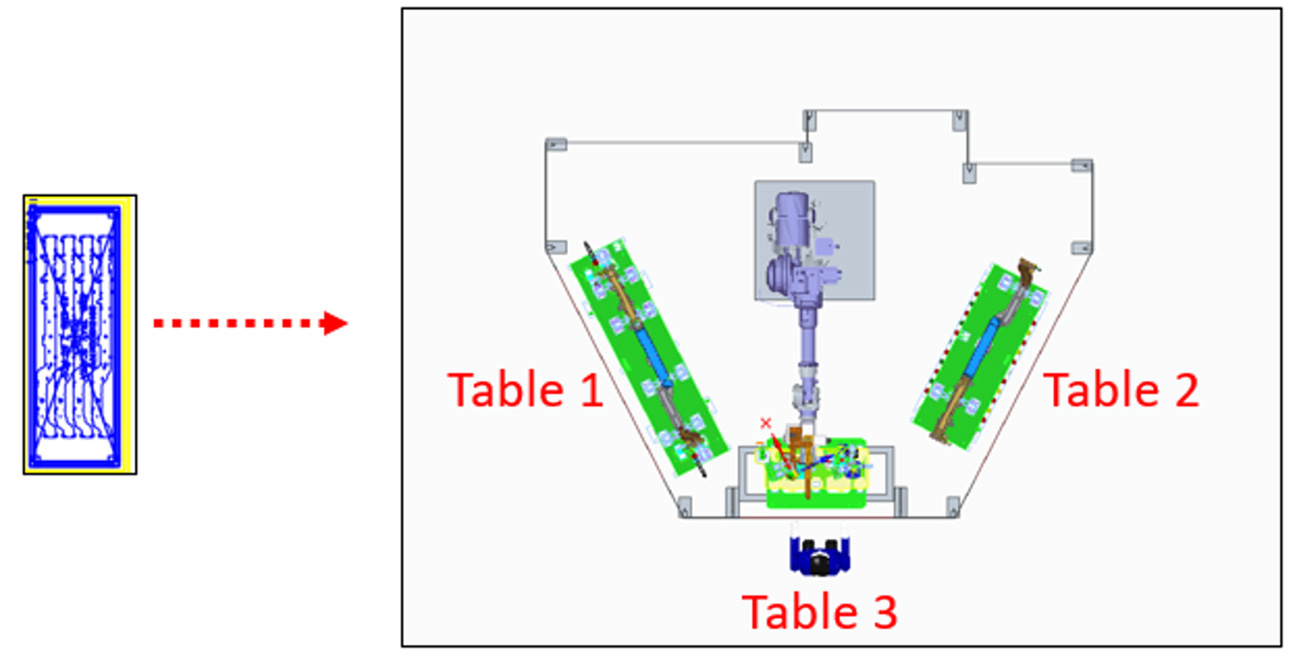
Figure 7 – Actual layout of the welding cell
The proposed change to the welding sequence aimed to reduce the geometry operations at tables 1 and 2, thereby lowering the overall line Takt Time.
In Figure 8 below, we can compare the proposals for table 1, where we see the result of the current welding sequence of the production line on the left, compared with the dimensional result of the proposed welding sequence, in the image on the right. The simulation inputs included CAD data, material properties, support points and clamps, location features, welding type and sequence, assembly sequence, and support positions. AutoForm Assembly calculates the deviation scenarios present in the process, as well as reaction and shear forces at the weld points, in addition to evaluating the influence of fixture positions and spot welding sequence on the dimensional behavior of the assembly.
As shown in the image below and in the detailed view presenting two simulation results generated in AutoForm Assembly, changing the spot welding sequence led to a reversal of dimensional deviation in one of the critical regions of the product. An initial negative deviation of approximately 0.219 mm, indicated by the greenish color in the image on the left, shifted to a positive deviation of about 1.06 mm, shown by the orange color in the image on the right, after modifying the spot welding sequence at the geometry station (table 1).
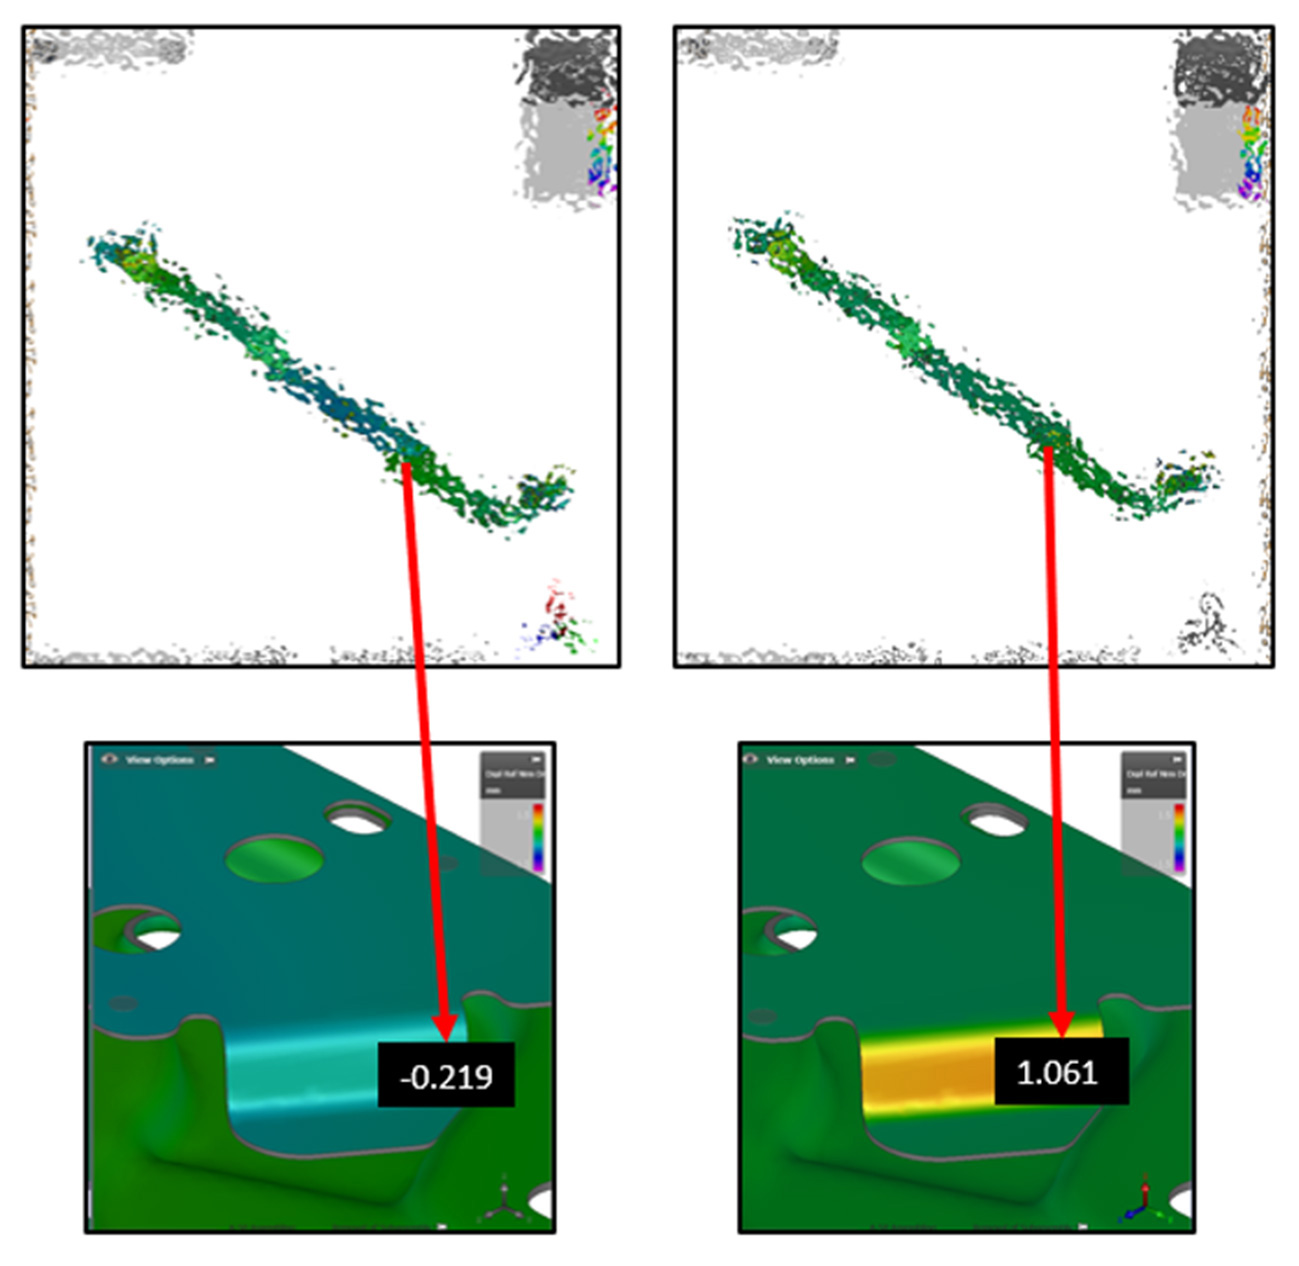
Figure 8 – Change in the sequence of welding points
When analyzing the impact of this change on table 2, the results show that dimensional stability is maintained during the Respot operations, as shown in Figure 9. In both cases, the dimensional deviation characteristics remain consistent.
In another upper region of the part, the deviation remains in the same range of approximately 1.91 mm for both assemblies, regardless of the welding sequence applied at table 1. This confirms that, at this stage, the assembly still presents regions outside the dimensional tolerance requested by the customer.
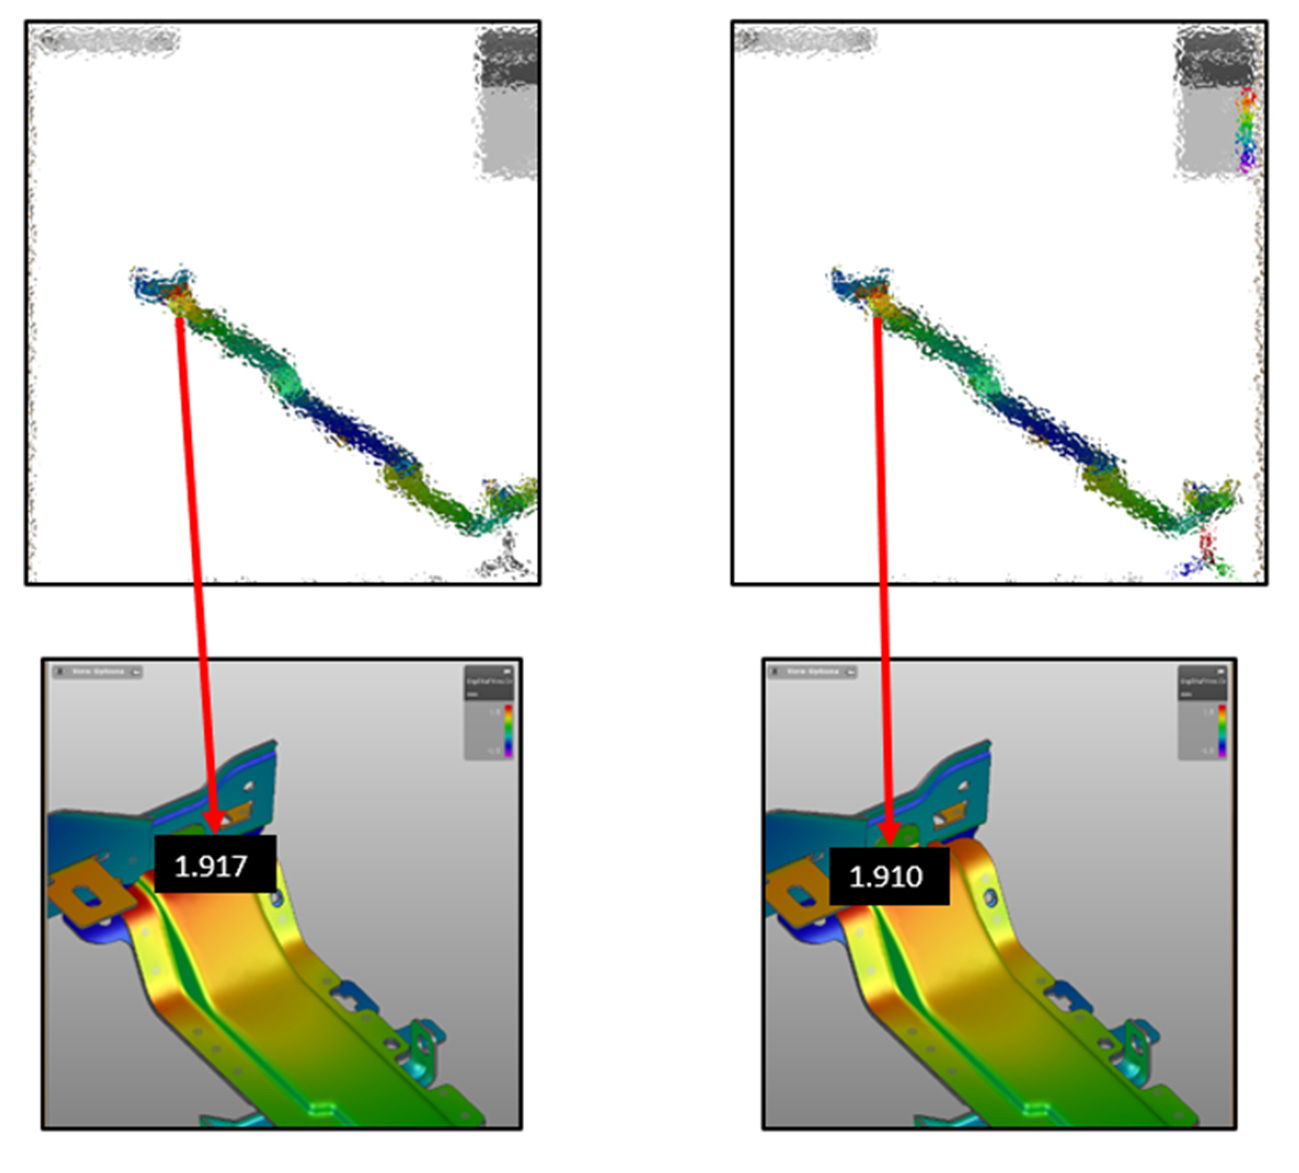
Figure 9 – Dimensional comparison on table 2
In practical terms, modifying the resistance spot welding sequence by transferring geometry points from the Geo operation to the Respot operation does not affect the dimensional result of the assembly. At the same time, it enables a reduction in line cycle time, since the Geo operation was previously a bottleneck in the production flow.
To support this change, robot sequencing was adjusted using offline robot and process simulation software, as shown in Figure 10. Within this environment, access conditions were verified and reprogramming led to a reduction in the total cycle time of the operations under study.
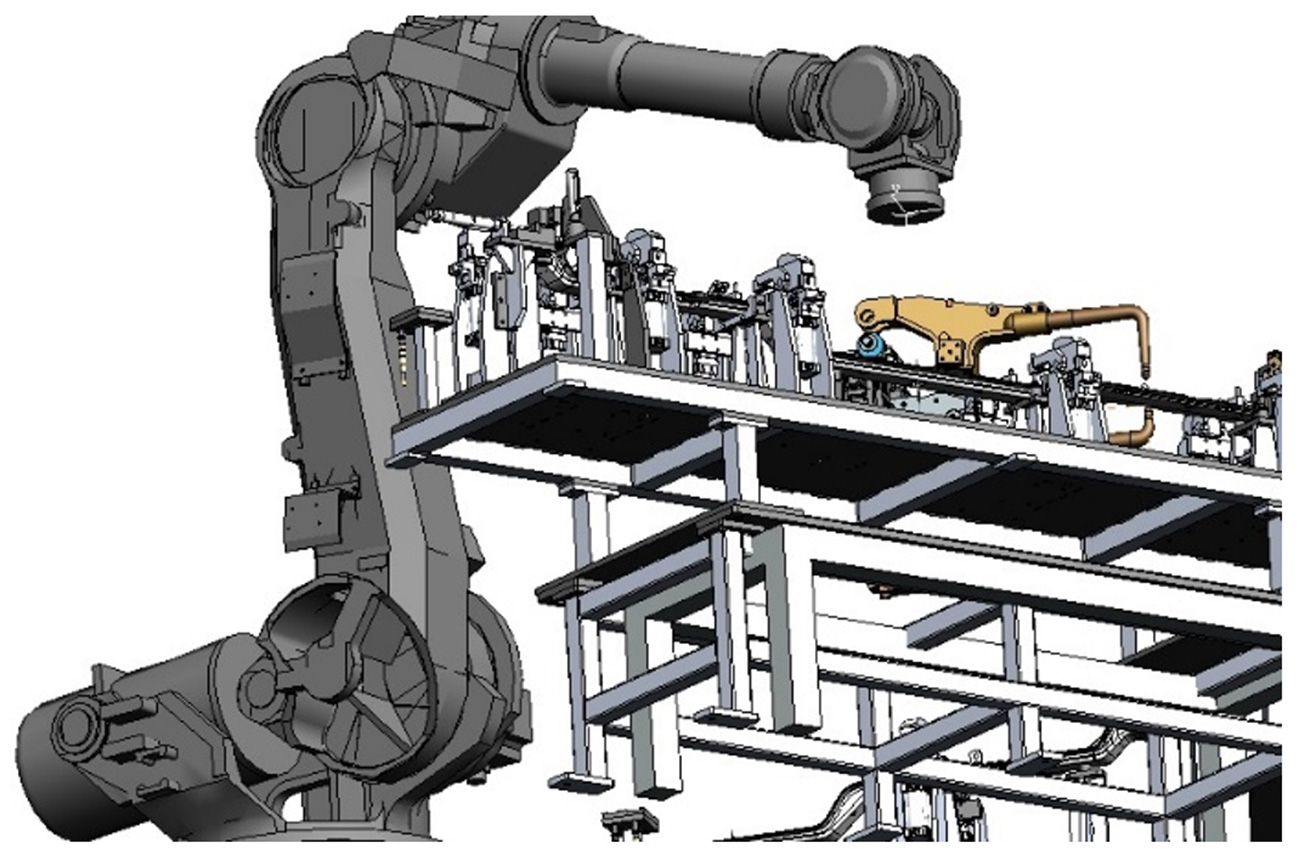
Figure 10 – Offline robot simulation software
As a result, the combined cycle time for tables 1 and 2 was reduced from the initial 5.31 minutes to 4.94 minutes, corresponding to a reduction of approximately 7%. This improvement allows additional assemblies to be produced per shift, significantly increasing the productivity of the item.
As mentioned earlier, the assembly still exhibited regions outside the specified dimensional tolerance and required further adjustment. For this reason, the fixture clamps used in the process were also re-analyzed, and several changes were proposed as part of the study.
For the clamps located in the lower region under analysis at table 1, multiple alternative clamp positioning configurations were evaluated. These tests resulted in a significant dimensional improvement of the assembly in this area.
As shown in Figure 11, the initial deviation of approximately 0.598 mm was reduced to around 0.327 mm after modifying the clamp force and positioning, representing a real improvement of approximately 45%.
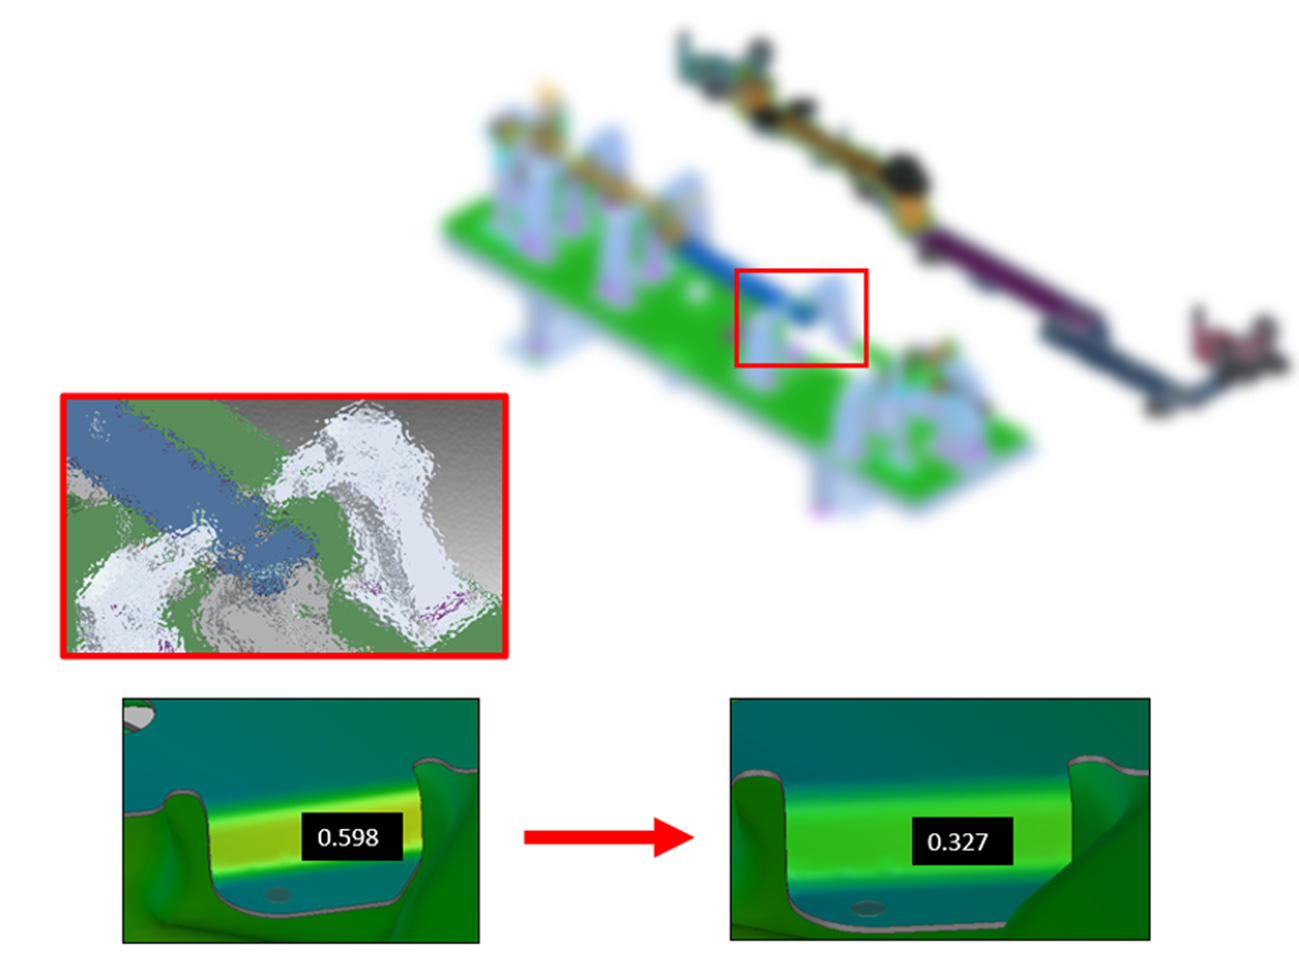
Figure 11- Dimensional improvement due to change in table fixing 1
At table 2, the addition of a simple support and pilot in the upper region of the product significantly reduced the deviation in the Z direction. The deviation decreased from approximately 1.910 mm to about 0.616 mm, resulting in a dimensional improvement of approximately 67.75%.
This result is shown in Figure 12
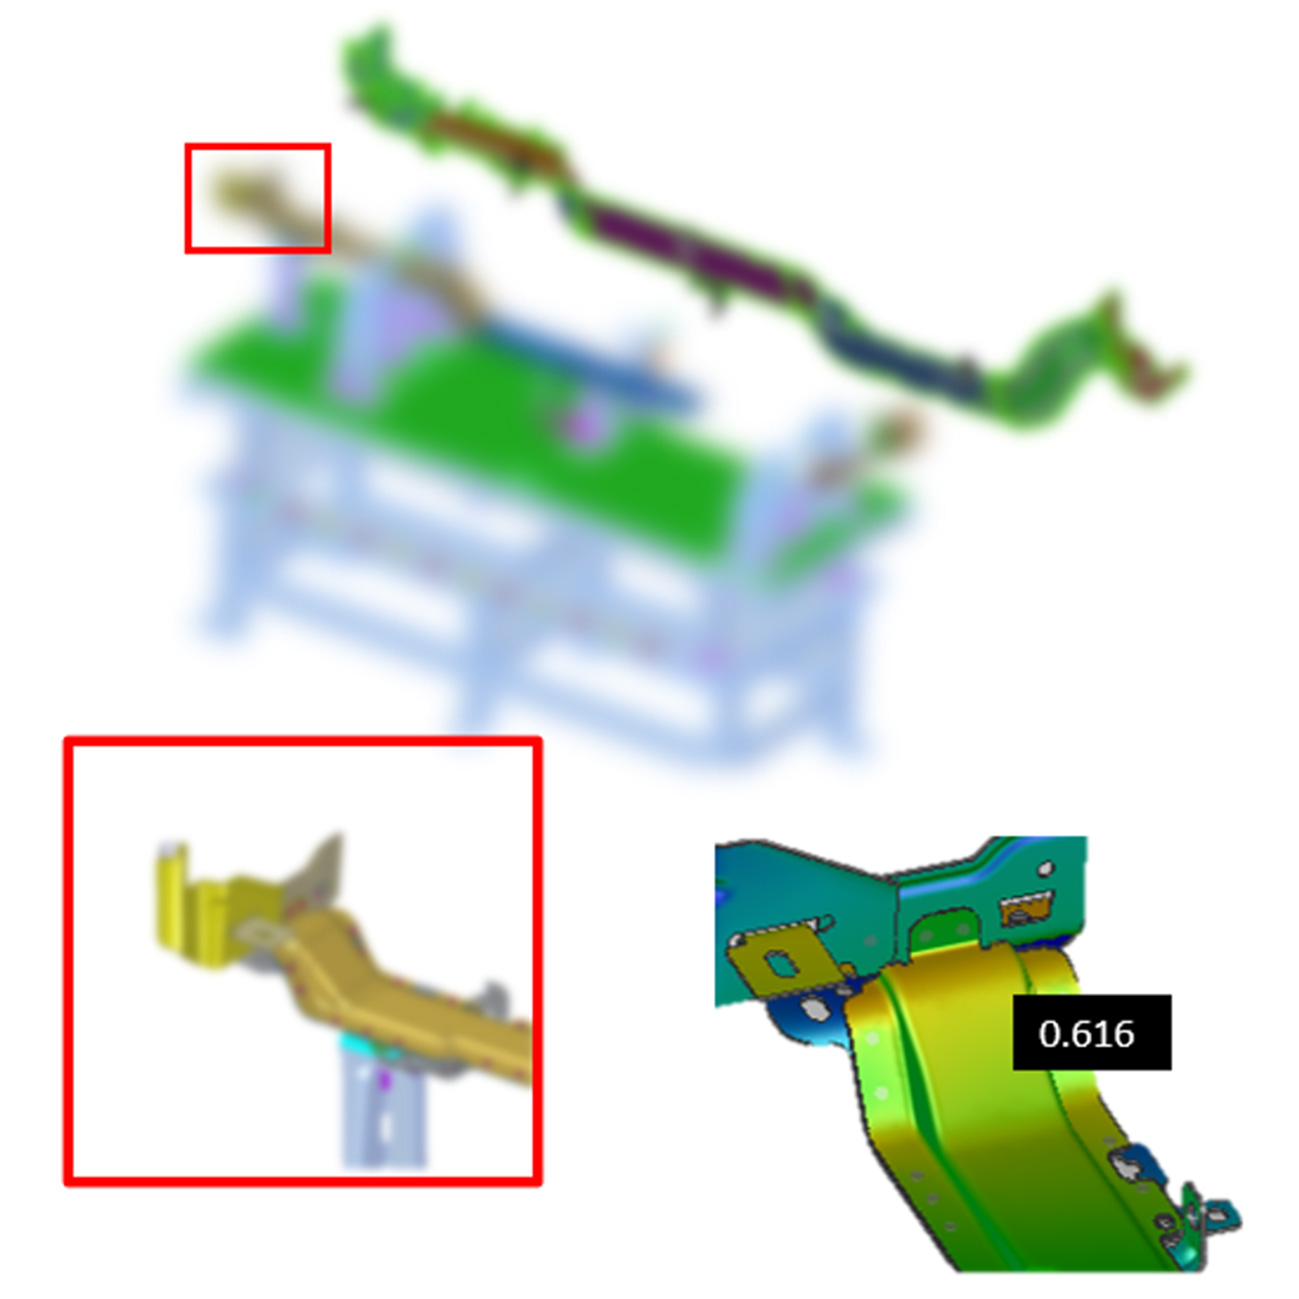
Figure 12 – Dimensional improvement due to change in table fixing 2
Together, these results show that creating a digital twin of the welding process using AutoForm Assembly, combined with kinematic simulation and offline robot programming tools, enabled dimensional improvements ranging from approximately 45% at table 1 to nearly 70% at table 2. In parallel, a Takt Time reduction of approximately 7% was achieved, along with increased production output.
The simulations also clearly identified which fixture points should be modified in the existing physical equipment, providing direct and actionable guidance for implementation on the shop floor.
As a result, tryout activities and empirical testing can be significantly reduced, enabling further gains in efficiency, time, and cost throughout the process.
The authors thank the Bruning Tecnometal team, José Eduardo Zanon, Aquiles da Silva Schauenberg, Elenon Cunha, and Jonas Adão Linn, for their dedication throughout the analyses and for recognizing, much like Neo in The Matrix, that there are always two paths to choose from and that an innovative path can move organizations beyond their comfort zone and deliver meaningful results.
References:
- https://asmltd.com/tolerance-stack-analysis-benefits-steps-involved-mechanical-design/
- https://blog.nvidia.com.br/blog/fabrica-virtual-digitalizacao-industrial/
- Stapefeld, C. Verinfachte Modelle zur Schweißverzugsberechnung, Ph.D. Thesis, BTU Cottbus, Alemanha (2016) ISBN: 978-3-8440-4142-2
- https://www.bruning.com.br/#about
- Hägele, K. Nilsson, N. Pires, R. Bischoff, Industrial robotics, Springer Handbook of Robotics, 2nd Edition, 2016 pp. 1385–1421 Wagg, D., Worden, K. orcid.org/0000-0002-1035-238X, Barthorpe, R. et al. (1 more author) (2020) Digital twins: State-of-the-art future directions for modelling and simulation in engineering dynamics applications. ASCE – ASME Journal of Risk and Uncertainty in Engineering Systems, Part B. Mechanical Engineering, 6 (3). 030901. ISSN 2332-9017


?")


")