
Early Work Pays Off: Establishing Countermeasures with Early Robustness Studies
In this blog post, readers learn how the range of springback can be reduced in the early phase of part optimization. This topic was presented at the “23. Umformtechnisches Kolloquium Hannover” in March 2020. The original lecture content was printed in the conference brochure. The conference was one of the few events that took place in Germany in 2020, with events scheduled later in the year being canceled due to the pandemic. AutoForm hosted a booth at the event. Together with my colleague Ulrich Kyas, we explore the current status of forming technology.
Robust Springback
Popular lightweight strategies such as using thinner high-strength materials or aluminum result in increased springback of body parts. In this blog post, I cover a process for part optimization with regard to the springback behavior on an inner hood. Figure 1 shows the OP sequence of the forming process. The hood inner is made from an aluminum sheet (EN-AW-5182-O/H111).
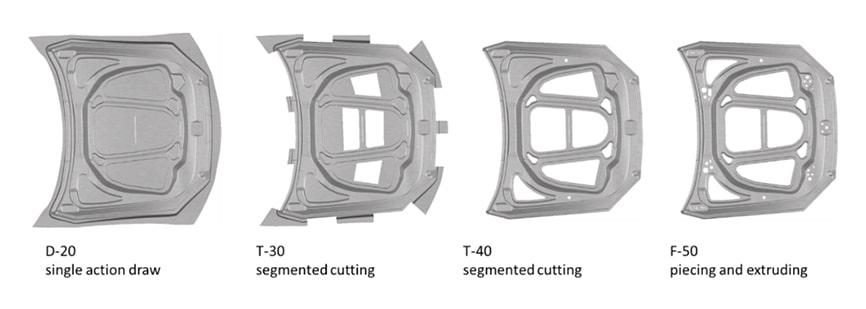 Figure 1: OP sequence of the forming process
Figure 2 shows the springback result of the single simulation. The maximum springback values are about 2.5 mm in the corner region (upwards) and about 11.0 mm of material displacement in the middle of the part (downwards). Because the springback measurement is affected by the positioning of the panel (alignment), the position of the clamp and its closure sequence, we replicated the exact gauge and procedure within the software. Two pilots in a round and an elongated hole prevent the component from being shifted or rotated in the part plane. The part is placed on four support points (clamps).
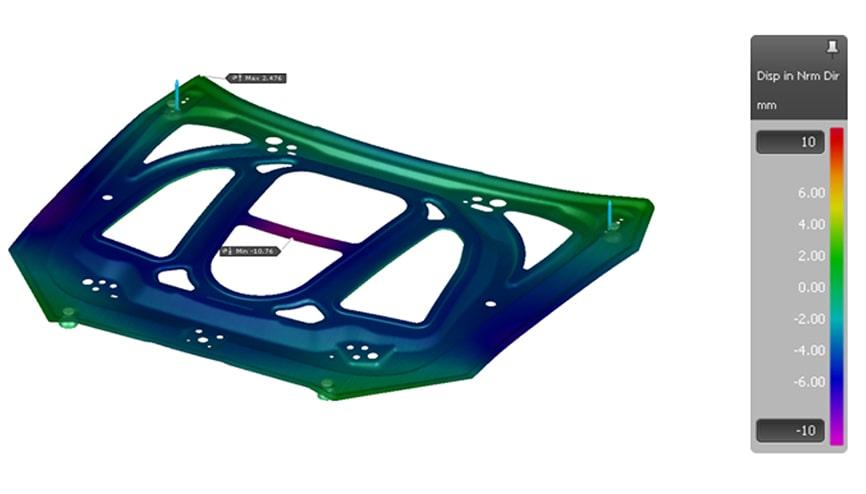
Figure 2: Springback result of the base simulation, taking into account the clamping concept
Due to the low part stiffness, the force of gravity has a major influence on the springback result in this part. For the subsequent springback compensation, this means that the compensation must be based on the springback result in the measuring gauge. A shift in the support points would lead to a different springback result, as the part would then sag differently. In addition, due to the low stiffness, the panel sags in the middle because of gravity. No need to mention, but this affects the final springback. Since this is what is going to happen to the panel when assembled with the rest of the hood sub-assembly parts (measurement position represents car position) we have to compensate exactly the springback measured with this set-up (no alternative methods and/or positioning must be used).
As mentioned, the result of a single simulation is not sufficient to assess which problems will arise later with regard to dimensional accuracy. The robustness of the process is examined using AutoForm. Table 1 shows the parameter variation. In order to consider the variation of the friction coefficient we set the variation of the amount of oil (the variation of the coefficient is therefore a consequence) since this parameter can be measured and controlled in reality. Several articles on this blog already highlighted the importance of simulating non-constant lubrication (friction) condition as more representative of the real phenomenon.
| Parameter | Min | Max | Standard deviation |
| Amount of lubricant | 0.9 g/m² | 1.1 g/m² | 0.03 g/m² |
| Binder force | 1170 kN | 1430 kN | 43 kN |
| Yield stress and tensile strength (correlation factor 0.8) | 120 N/mm² 250 N/mm² | 146 N/mm² 205 N/mm² | 4.4 N/mm² 9.3 N/mm² |
| Anisotropy (rm-Value) | -20% | +20% | 6,67% |
| Position of the blank in x- and y-direction | -1 mm | +1 mm | 0.33 mm |
Table 1: Examined parameter variations in the robustness analysis
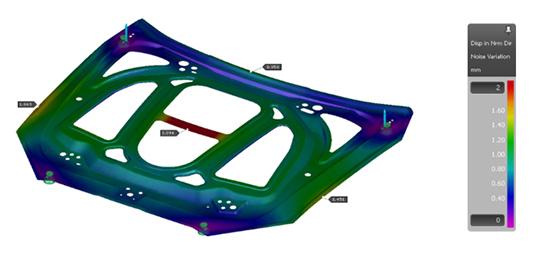
Fig. 3: Springback range due to noise parameter variation
Figure 3 shows the noise variation of the springback as a result of the robustness study. In the middle of the part, the noise of the springback is over 3.0 mm and about 1.7 mm at the hemming flange. This means the given manufacturing tolerance of +/- 0.7 mm cannot be adhered to in the critical areas. All regions with a noise variation greater than 1.4 mm cannot be manufactured robustly. Figure 4 shows the Cp-value, which is the quotient of the tolerance width (in this case, Tol=1.4 mm) and the 6sigma variation (the spread from Figure 3). The amount of scrap can also be determined from the Cp-value. In the image, the traffic light display clearly shows the critical areas.
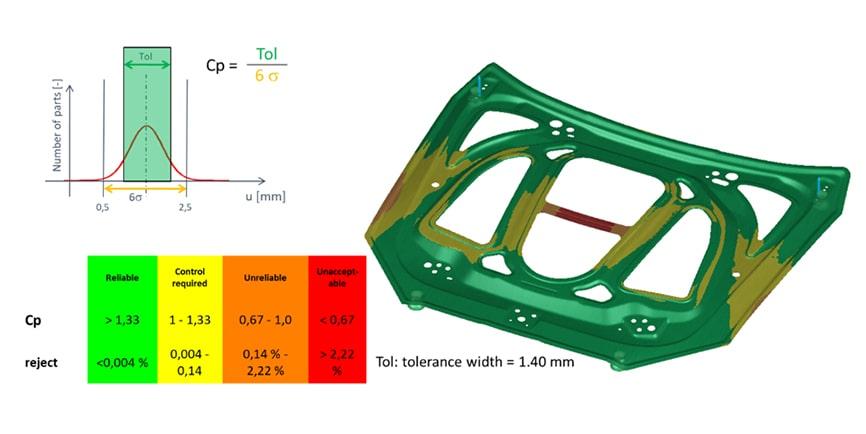
Fig. 4: Process capability index (Cp-Value) of springback
The noise variation of the springback and the reject rate will both be determined later on. The next question is: which parameter has the greatest impact on the springback result? Figure 5 shows the dominant variable of the springback result. The strength and anisotropy of the sheet material have the greatest influence in the critical regions. There is no solution because the most dominant values are material connected and we have to live with that. One could restrict the variation of the material charges. However, this leads to higher material costs, meaning it often cannot be implemented.
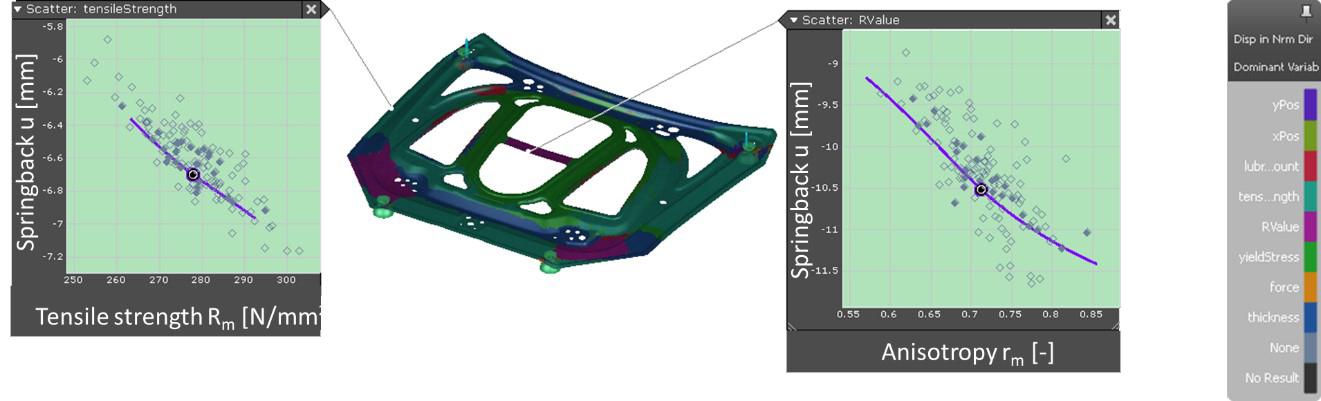
Figure 5: Dominant variables for springback (click to enlarge)
Springback Reduction with SPI
The robustness analysis shows that the forming process is not robust. Narrowing down the material charge is too expensive and is consequently not an option in this case. It is therefore necessary to take alternative measures to ensure a robust process. First, to improve the process, the extension of the sheet metal should be increased by means of drawbeads. If this is not sufficient, a possible part optimization should be considered. This is only possible at an early stage of development. For this reason, the robust springback investigation must be carried out in parallel with the early feasibility study.
Optimization of the part geometry
AutoForm-Sigma can be used for robustness analysis and optimization. Here, four radii and the height of a depression bead in the middle of the part were varied. The radii were changed symmetrically on the left and right side of the part. In contrast to a robustness analysis, a rectangular distribution was used for the variation, rather than a normal distribution. Instead of the most critical result, the optimum is sought through the evaluation, using a method called systematic process improvement (SPI). In this case, the optimum encompasses a process that can be produced with minimal springback variation. This is why the robust systematic process improvement (R-SPI) was incorporated.
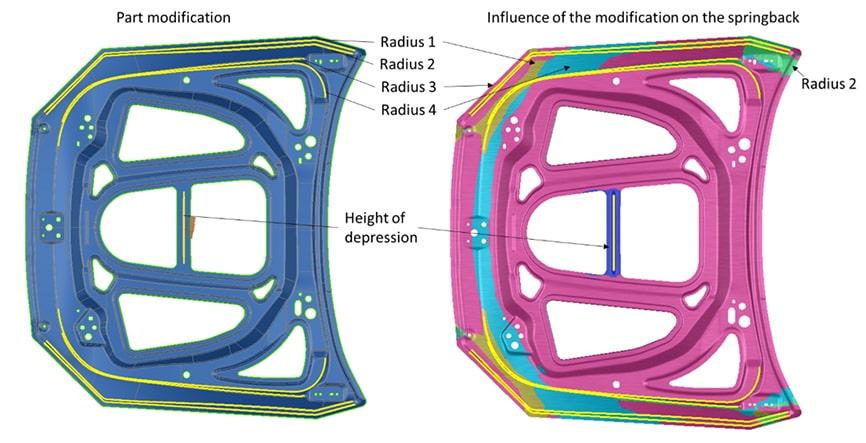
Fig. 6: Optimization of the part geometry in terms of springback and process reliability
Figure 6 shows which part modifications have the greatest influence on the springback result. As expected, the height of the depression in the middle of the part has the greatest influence on the critical area in the middle of the part. However, it was not apparent from the beginning that the change in the inside radius 4 would have the greatest influence on the rebate flange.
Figure 7 shows how the individual component parameters can be varied in AutoForm-Sigma with the help of sliders and the result can be evaluated directly. The comparison between Figure 4 and Figure 7 illustrates the increase in robustness with regard to springback. Since the robustness of the process is also considered here during component optimization, the process limits with regard to cracks can also be expanded.
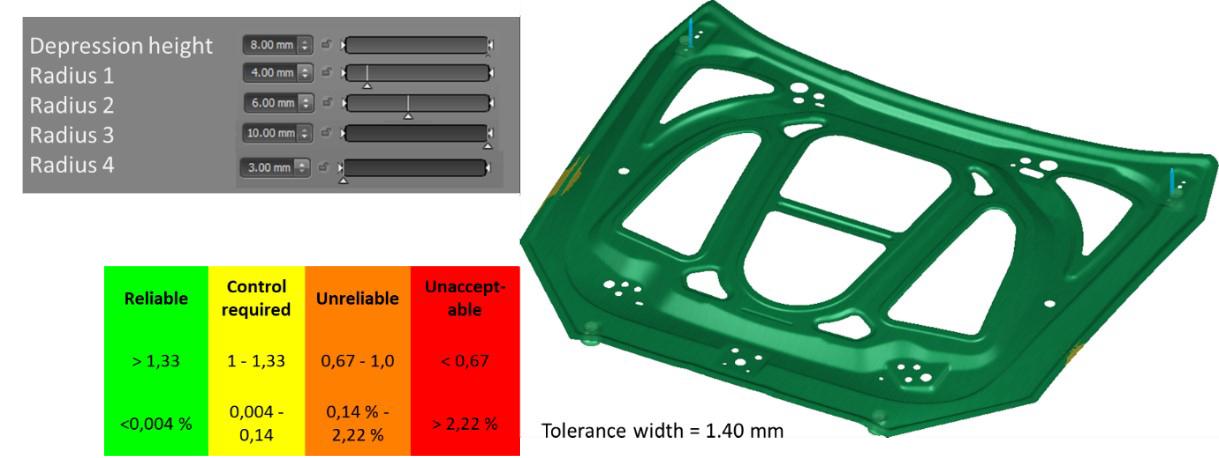
Fig. 7: Process capability index (Cp-Value) of springback for the optimized part (click to enlarge)
Another advantage of running robustness evaluations is the simple and clear presentation of how individual influencing variables impact the result. It is extremely helpful to recognize that certain modifications have no influence on the result. This is often not possible through many individual simulations. The optimization result also shows that with a complex component, a small radius does not always lead to a smaller setback.
Springback Compensation
With the help of the robust systematic process improvement (R-SPI), the part was changed in such a way that it can now be manufactured robustly. However, the springback of the part is still outside the required tolerance and must be compensated through digital engineering.
Compensation strategy
Figure 8 shows the strategy and method for springback compensation, i.e., which operation is compensated using which springback result. The aim is to compensate as little as possible. The drawing step D-20 is compensated with the springback result of the measuring gauge M‑100, as previously described.
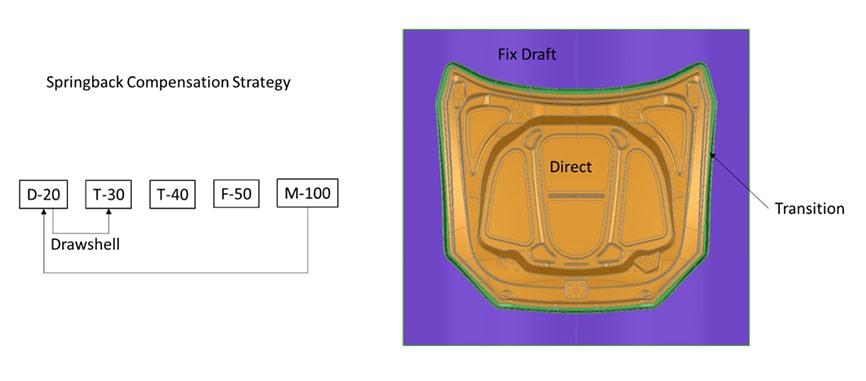
Fig. 8: Springback compensation strategy and method
The post and pad of the first trimming operation are compensated using the “drawshell concept”. This means that in operation T-30, the trimming tool receives the geometry of the sprung back part after drawing D-20. This process is described in the following article:
“The Challenge of Compensation: The Use of the Draw-Shell Method”
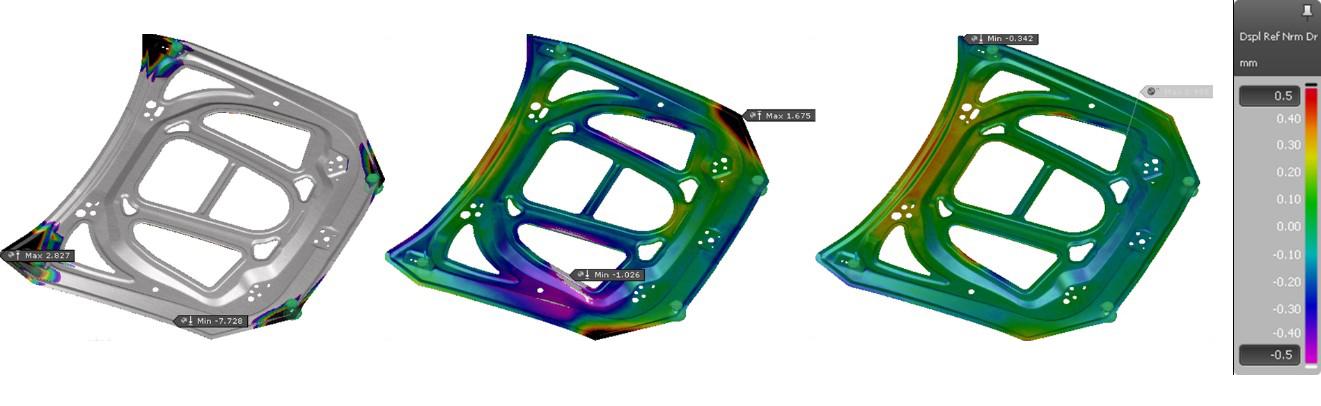
Fig. 9: Result of the springback compensation (click to enlarge)
Figure 9 shows the distance from the reference geometry after each compensation loop. In the first iteration, there are only a few regions where the distance to the reference geometry is over 0.5 mm. After the second iteration, the whole part is inside a tolerance of +/- 0.5 mm.
Summary and Outlook
The springback compensation was pretty straightforward in this case because the real work was completed in advance. The part was optimized in such a way that the springback was robust. For countermeasures to be taken, the robustness study should be carried out at an early stage of the feasibility study. In addition to cracks and folds, the feasibility study also includes springback. With optimization solutions like robustness studies through SPI, many optimizations can be automated, which saves time and the evaluation leads to greater transparency.


?")


