
In a collaborative study, AutoForm, Volvo Cars, and the Department of Mechanical Engineering at the Blekinge Institute of Technology in Sweden analyzed the influence of tooling roughness on simulation accuracy. Volvo Cars provided surface measurement data collected between 2015 and 2023 from a variety of production and tryout tools.
This study focused on 100 surface measurements from the toolset, comprising 39 from dies, 41 from blank holders, and 20 from punches. Measurements were taken from multiple locations and surfaces on each tool component, including both flat and curved surfaces (see Figures 1 and 2). These were collected using 3D confocal microscopy to capture the three-dimensional surface characteristics, with the results expressed as surface roughness (Sa value). We used the median instead of the mean value, as it provides greater robustness against outlier values.
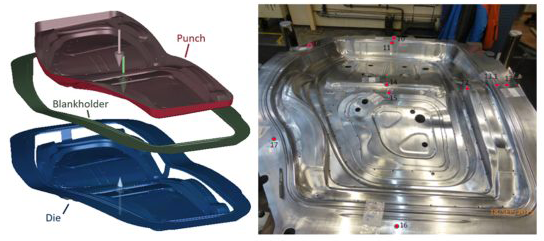
Fig. 1: Tool set of a rear door inner part modeled in AutoForm.
Fig. 2: Example of surface measurement locations of a rear door inner part.
The research then involved detailed analysis of each of the 100 measurements. Notably, flat and radii areas were plotted separately within each scan to generate data points for different scenarios.
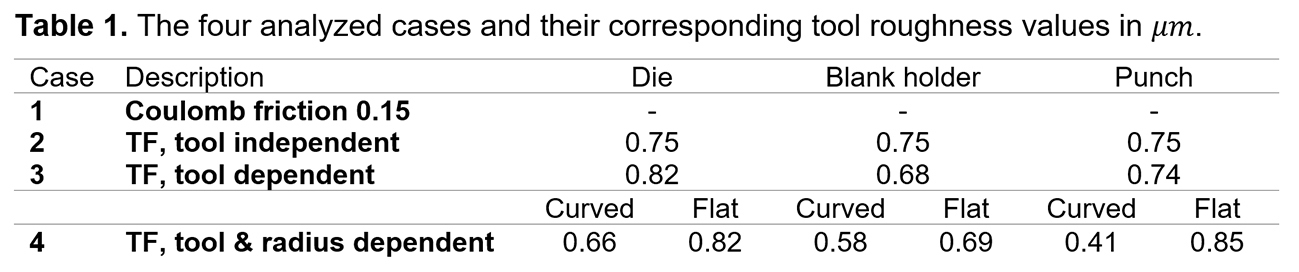
The study was then divided into four cases to evaluate the effect of accurate tooling roughness values on simulation accuracy:
- Using the Coulomb friction model.
- Using TriboForm friction with an average Sa roughness value.
- Using TriboForm friction with varied roughness values for different tool components.
- Using TriboForm friction with varied roughness values for different tool components and for the flat and radii areas within each component.
We conducted simulations for these four cases using the values presented in Table 1 and compared the outcomes.
Results
The results of the study illuminate how precise tooling roughness values influence simulation accuracy. Let’s examine each case in detail.
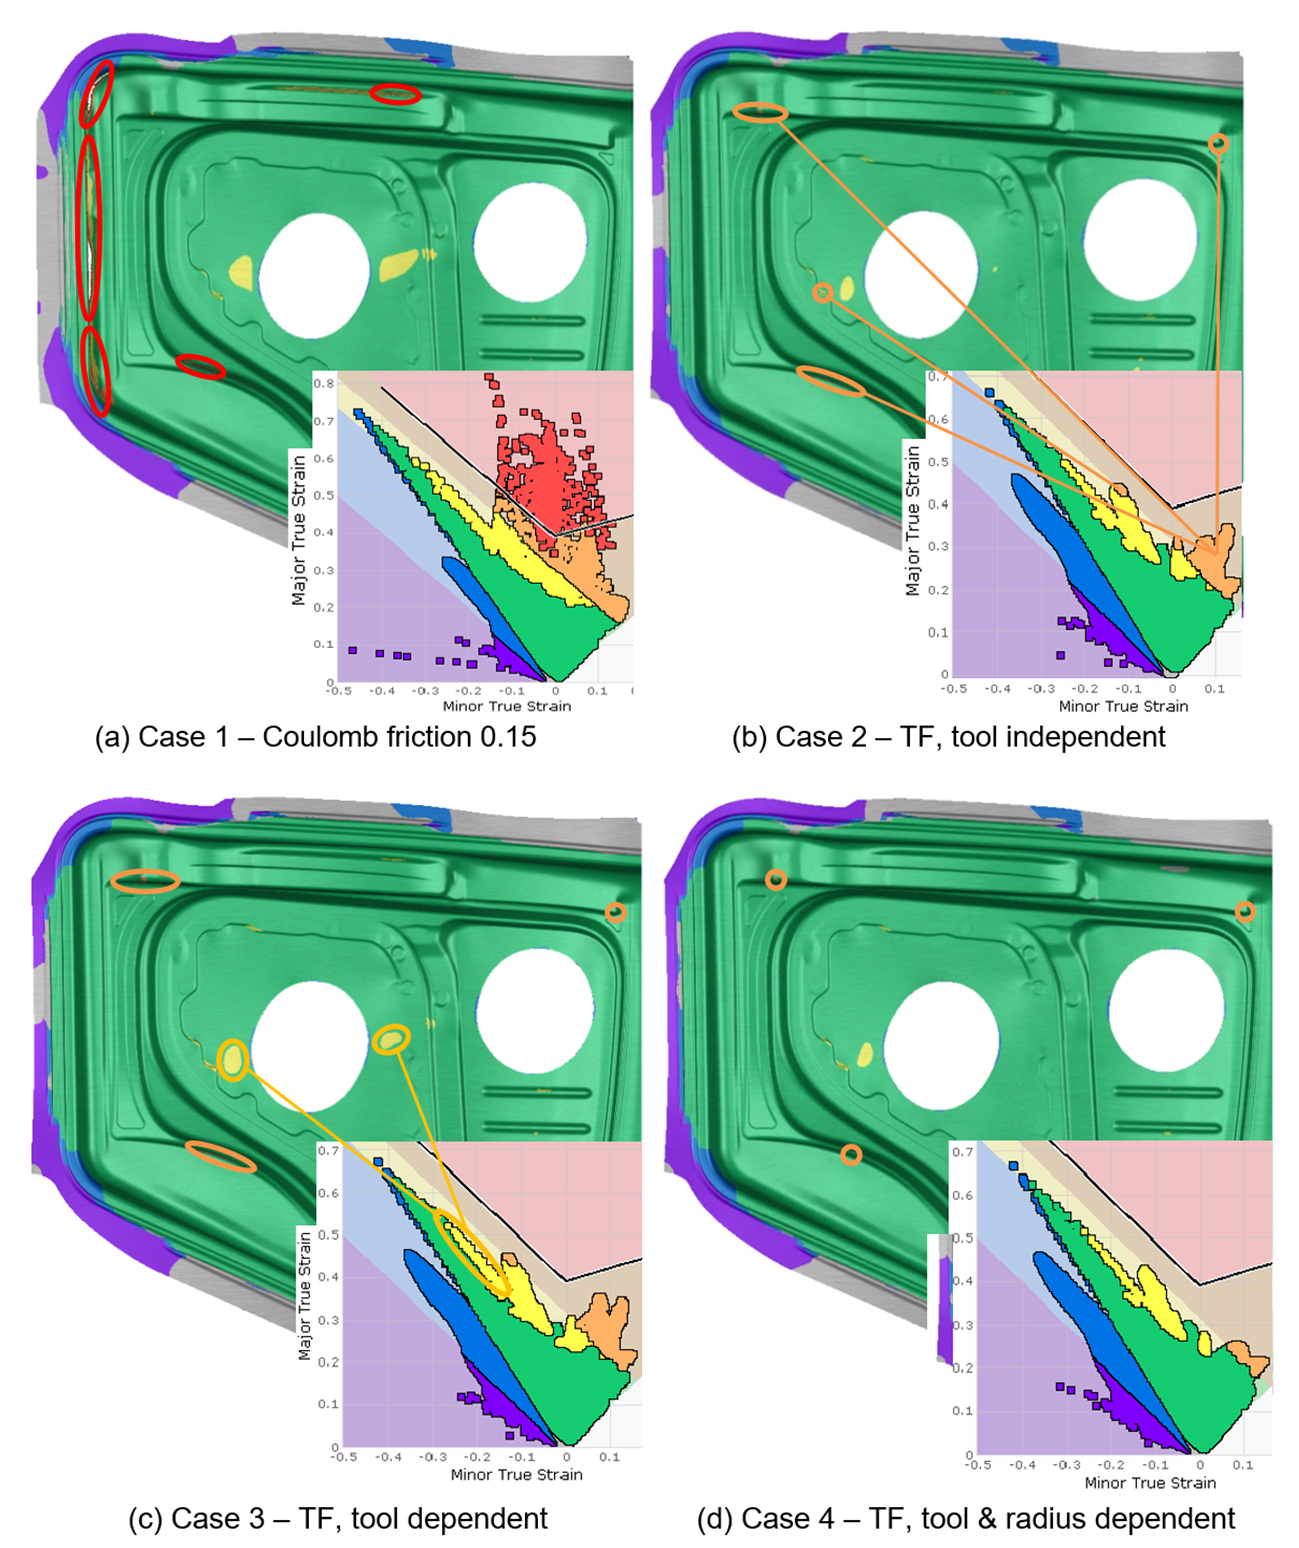
Figure 3. Advanced formability results of all four cases at the end of drawing, showing the formability across the part as well as the FLD.
Case 1
Using a fixed friction coefficient of 0.15, the Coulomb friction model simulation predicted a part failure, evident in the Forming Limit Diagram (FLD) shown in Figure 3a. However, this is not what happened in reality, as Volvo Cars successfully formed the part using the same geometry, die, and process.
Relying solely on the simulation results could have misled the engineers to perform unnecessary process or die geometry modifications. This discrepancy highlights that, despite its widespread industry use, the Coulomb friction model can produce inaccurate results that do not correspond with real-world outcomes.
Case 2
In the second case, shown in Figure 3b, TriboForm friction was applied using a uniform average tooling roughness value of 0.75 μm across all tool components—blank holder, die, and punch. The AutoForm software then adjusted friction values at different locations based on local process conditions like pressure, strain, and velocity. Curved areas, like drawbeads, experience higher contact pressures, resulting in lower friction coefficients. In contrast, flatter areas tend to have higher friction coefficients.
The friction models used in Case 1 and Case 2 differ significantly, leading to very different results. In Case 2, the simulation adhered to the Forming Limit Curve (FLC), and as a result, no fractures were predicted. However, the parts still showed excessive thinning and risk of splits in some locations, marking them critical yet still formable.
Case 3
For Case 3, we adopted a more realistic approach by assigning unique tool roughness values to each tool component. This better reflects actual manufacturing conditions than maintaining a uniform value across the board. That said, the roughness values may vary only slightly across the individual components. Specifically, we used roughness values of 0.82 μm for the die, 0.68 μm for the blank holder, and 0.74 μm for the punch.
The results from this simulation, shown in Figure 3c, deviated only slightly from those in Case 2. This can be attributed to the relatively small differences in roughness values among the different tool components.
Case 4
In the final case, we further mirrored reality by varying the tooling roughness values not only for each component but also based on the geometry. Specifically, flatter areas were assigned higher tooling roughness values compared to the curved areas. This approach reflects real-world polishing practices, where curved areas typically receive more attention, resulting in smoother surfaces. Smoother surfaces in these curved areas then lead to reduced friction shear stress, significantly impacting the final part quality.
By assigning lower roughness values to the curved areas compared to the flat areas, we closely replicated real-world conditions. The simulation results corroborated this approach, with the least critical parts observed in Case 4, aligning with the actual outcomes at Volvo Cars.
While the part still showed some thinning areas, it may still be accepted for milling provided it meets the company’s quality standards. Thus, the fourth case yielded the most accurate results when the tooling roughness was varied for both the tool and the location.
Key Takeaways
From the above study, we can safely arrive at the following conclusions:
- Tool roughness varies not only among different tool components but also within each component, depending on the location.
- Tool roughness plays a significant role in tribological conditions.
- Incorporating tool roughness dependency increases simulation accuracy.
- There is potential to further optimize the tribology systems, particularly in determining optimal tool polishing techniques to ensure defect-free parts.
Conclusion
This study shows that an accurate tooling roughness value can make the difference between a successful and unsuccessful simulation. Accurate simulations of new designs can prevent unnecessary modifications, significantly reducing the resources and time required for a project.
Looking ahead, our plan is to analyze a much larger set of surface measurements to improve the statistical significance of our findings. The project will expand to investigate milled surfaces and explore how tooling roughness values affect tool wear and galling, which is to say, tool life.
References
[1] Domhof, A., Waanders, D., Hol, J., and Sigvant, M. 2023. “Friction and lubrication modelling in sheet metal forming: Influence of local tool roughness on product quality.” IOP Conf. Ser. Mater. Sci. Eng. 1284


?")


