
This is part two of a two part series. See how AutoForm won the Numisheet Industrial Benchmark 2025 in part one.
AutoForm has won the Numisheet Scientific Benchmark 2025. Numisheet is a leading international conference series focused on the numerical simulation of sheet metal forming processes. Its benchmarks are a central part of the event: participants receive the task definition in advance, run their best simulations, and submit results such as strain distributions, forming forces, and final geometries. The experimental results are revealed only during the conference, where all submissions are compared and the most accurate prediction is awarded.
For the scientific benchmark, a material card for a DP800HHE (High Hole Expansion) had to be created. A large number of material tests at both micro and macro levels were provided for this purpose. The resulting model was then validated using a stretch forming process (MUC test). The ranking in the benchmark was based on predictions of plastic strains and forming force – values that were unknown to the participants at the time of submission.
The Test Set Behind the Material Card
We limited ourselves to the following tests for the creation of the material card:
- Uniaxial Tensile Test (Flow Curve, Lankford Parameters, uniaxial stress ratios)
- Hydraulic Bulge Test (extrapolate the flow curve)
- Tension-Compression Test (kinematic hardening parameter with the help of the AutoForm Material generator)
- Plane Strain Test (calibrate the yield locus at plane strain points)
- Shear Test (calibrate the yield locus at shear point)
- Layer Compression Test (determine biaxial r-Value rB)
- Nakajima Test to generate Forming Limit Diagram (FLD)
The tests were carried out at the Chair of Forming Technology and Foundry Engineering (utg) at the Technical University of Munich.
Uniaxial Tensile Test: The Real Starting Point for Flow Curves and r‑Values
As mentioned above, we restricted the material card work to seven test types. Having this breadth of data is exceptional—many projects provide only uniaxial tensile test results in three rolling directions, which is often the bare minimum. For the Numisheet benchmark, we therefore started with the essentials: deriving the flow curve and r-values from the uniaxial tensile test.
The uniaxial tensile test is a standard method for characterizing sheet materials—but it still offers a few details worth a closer look. Alongside force and the changes in length and width, the specimen temperature was recorded. From force and the evolving cross-section, the flow curve can be derived. Interestingly, temperature drops slightly during elastic loading, then rises once plastic deformation sets in. At the elastic–plastic transition, the temperature reaches a minimum—an effect often referred to as the Joule–Thomson effect.
This temperature signal can also support yield-strength determination. For many materials, the onset of plasticity is not clearly visible in the stress–strain curve. In practice, the yield strength Rp0.2 is therefore defined at 0.2% plastic strain. The following figure illustrates this effect clearly. The minimum temperature method provides a yield strength of 499 MPa, while Rp0.2 is found to be 550 MPa. In our case, we chose the minimum temperature method. Both approaches provide very similar forming results as this point is only the very beginning of the flow curves.
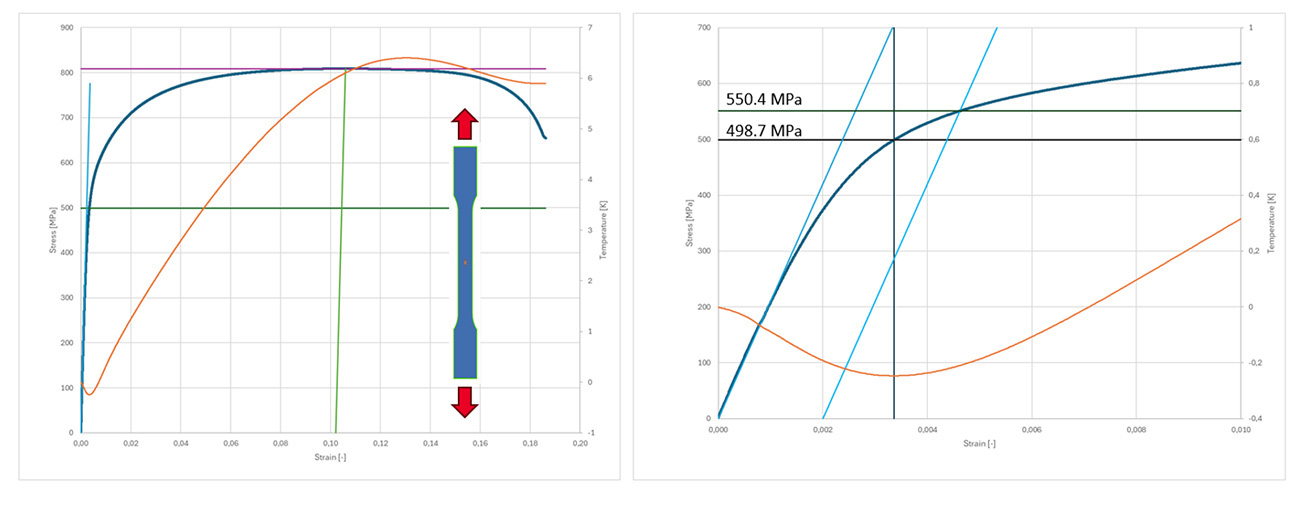
Figure 1: Determination of yield strength: at 0.2% strain and minimum Temperature
For material card generation, the flow curve in the rolling direction (0°) is imported as the reference. The flow curves for 45° and 90° are then derived in the AutoForm Material Generator using the scaling factors s45/s0 and s90/s0. These factors can be based either on yield-strength ratios or on tensile-strength ratios. Figure 2 highlights the difference: yield-strength scaling typically matches well only at low strain, whereas tensile-strength scaling often provides better agreement at medium to high plastic strains between the measured curves (solid) and the scaled/extrapolated curves (dotted).
Practical tip: Overlay the measured and scaled curves and choose the approach (yield strength or tensile strength) that delivers the best match in the strain range relevant for the forming operation.
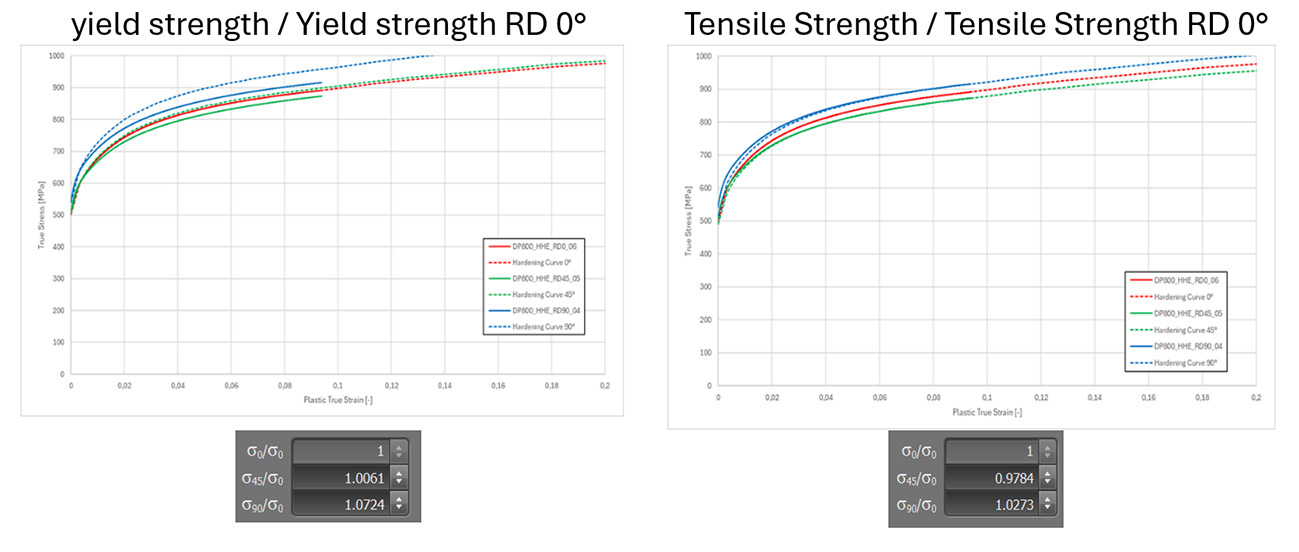
Figure 2 : Scaling the flow curve with yield stress and tensile strength
Uniaxial tensile data provides a reliable flow curve only up to uniform elongation. Beyond Ag, the specimen starts to neck, strains localize, and the stress–strain response is no longer representative of homogeneous material hardening. The post-uniform part therefore has to be extrapolated—here, Ag is only 10%.
Hydraulic bulge tests extend the accessible strain range, making them ideal for supporting flow-curve extrapolation. However, the bulge test runs under (near) biaxial loading, so its stress–strain curve cannot be transferred one-to-one to a uniaxial flow curve. DIN EN ISO 16808 [2], Annex D, outlines a practical route: determine the equibiaxial stress ratio and use it to map bulge-test results to an equivalent uniaxial stress–strain curve beyond uniform elongation.
Practical tip: Use bulge-test data to validate your extrapolation strategy and calibrate the mapping so the uniaxial and bulge-based curves connect smoothly at Ag.
Alongside the flow curve, the tensile test also delivers the r-values. The r-value describes a sheet’s resistance to thickness change and is defined as the ratio of true width strain to true thickness strain in plastic deformation. In Figure 3 (left), the r-value is plotted over true longitudinal strain. After uniform elongation (Ag = 10%), diffuse necking starts and the r-value can no longer be evaluated reliably. In the stable plastic range between εl = 0.04 and Ag, the r-value is nearly constant—so we use the average in this interval and then take the mean of three specimens.
Figure 3 (right) shows an alternative evaluation. Here, the r-value is obtained from a linear regression of true width strain versus true longitudinal strain, using the plastic strain range up to uniform elongation.
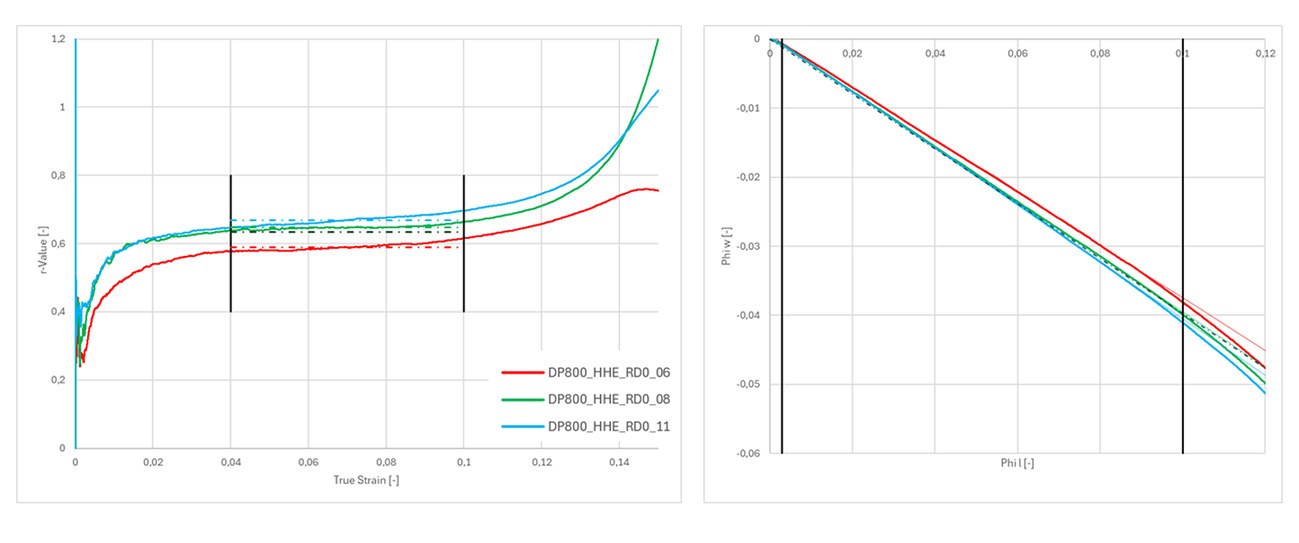
Figure 3: r-Value determination over strain – left: average value over longitudinal strain, right: linear regression over longitudinal strain
Figure 4 summarizes how the r-value varies with the angle to the rolling direction for both evaluation methods. The smallest directional scatter is observed in RD (0°) and TD (90°). The largest method-to-method deviation occurs at 45°—and this is also where the specimen-to-specimen scatter is highest. For the final material card, we therefore used the average of both evaluation approaches (orange points in Figure 4).
Practical tip: Don’t treat r as a single “material constant”—it varies with strain, shows specimen-to-specimen scatter, and can shift depending on the evaluation method.
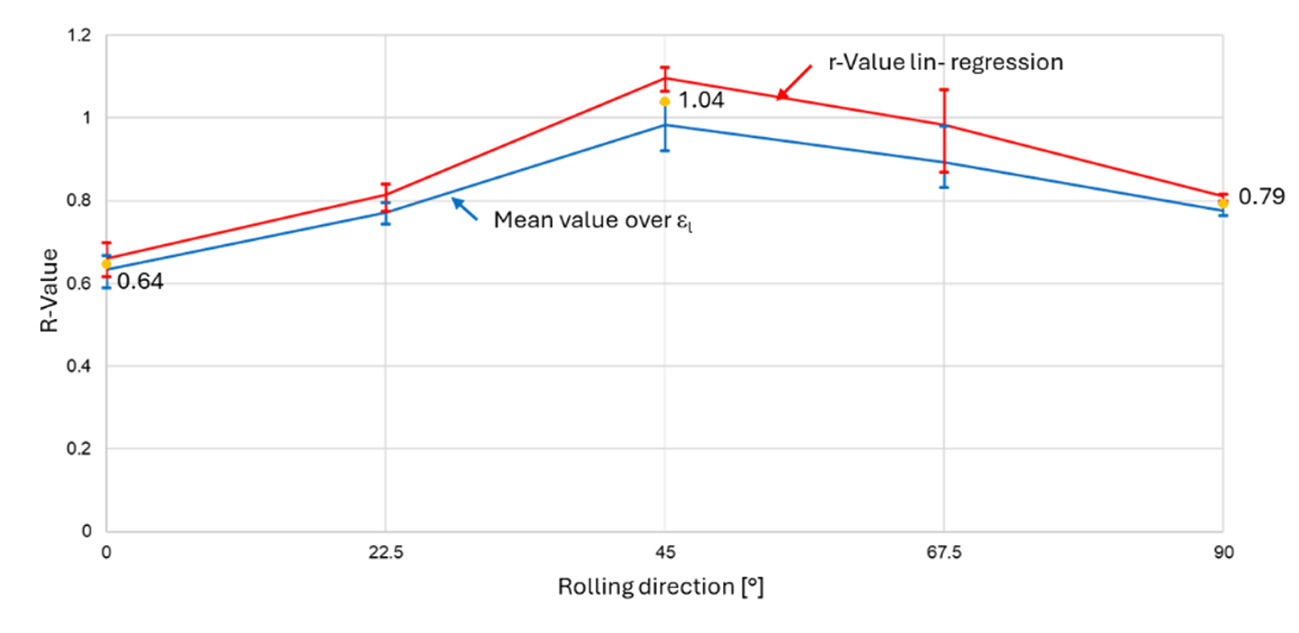
Figure 4: r-Value variation for different angles to the rolling direction and evaluation methods
Plane Strain Calibration: Matching Force and Strain Fields
We used the plane strain test to calibrate the yield locus under plane strain loading. A notched specimen was tested in three orientations to the rolling direction (0°, 45°, 90°); force–displacement curves and full-field strain data were provided (test details in [1]). Calibration was done by reverse engineering: we replicated the experiment in AutoForm and matched both the measured strain distribution and the forming force. Figure 5 shows the characteristic result—true plane strain is reached only in the specimen centre, where the minor strain approaches zero.
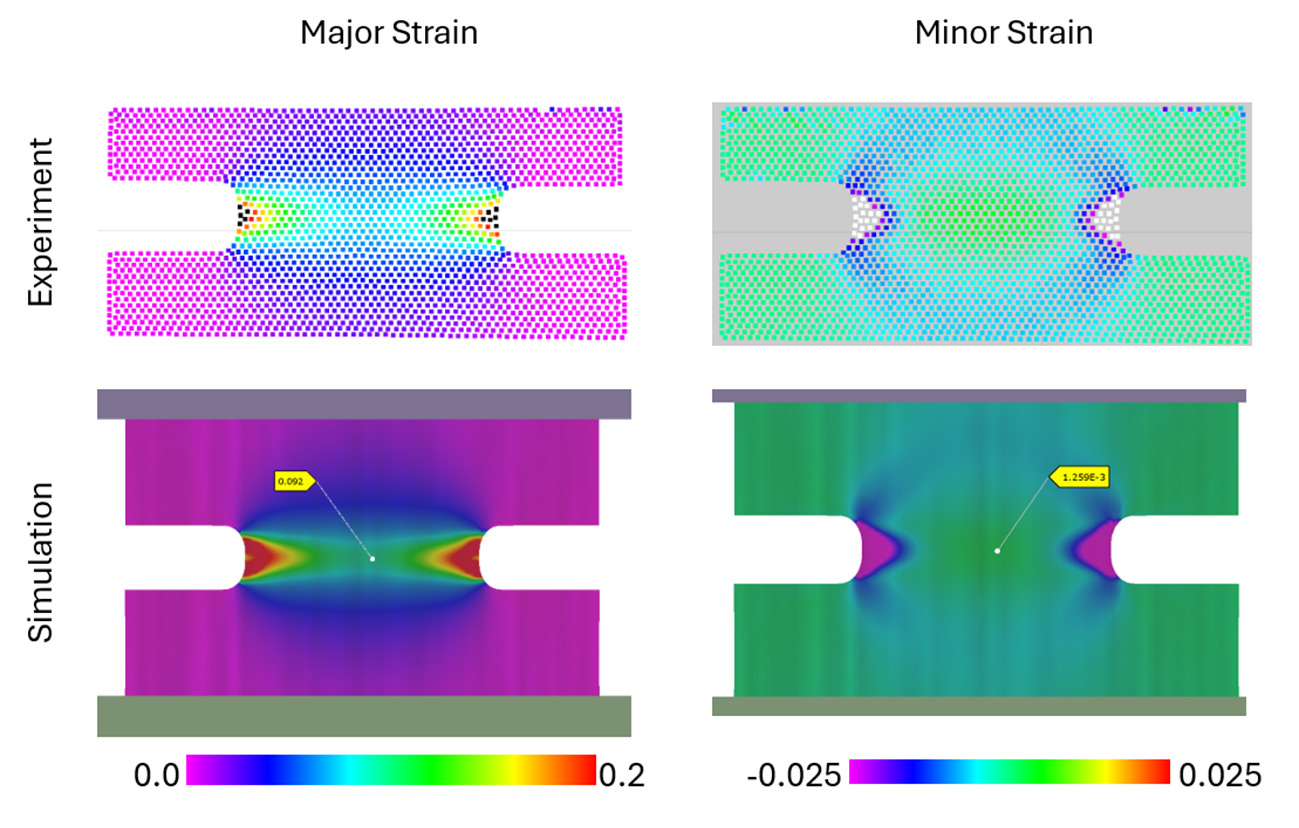
Figure 5: Comparison of Major- and Minor Strain from experiment and simulation
The plane-strain point cannot be taken directly from the plane strain test. Instead, we varied the plane-strain point in the simulation and benchmarked each variant against the experiment—using the force–displacement curve and the measured strain fields as targets (Figure 6 and Figure 7).
A key takeaway was the trade-off: a good force match did not automatically mean a good strain match—and vice versa. Only after adding strain-rate sensitivity could we align both force and strain with the experiment. Physically, higher forming speeds raise the apparent flow stress, which in turn reduces strain localization.
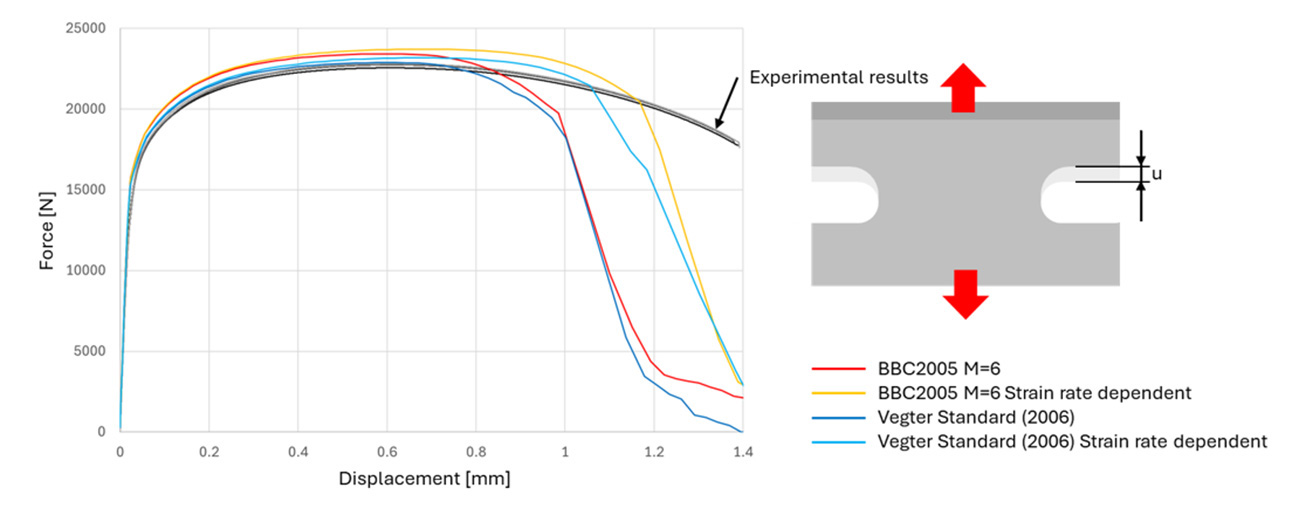
Figure 6: Force Displacement Plot – Compare Force with and without strain rate dependent material card
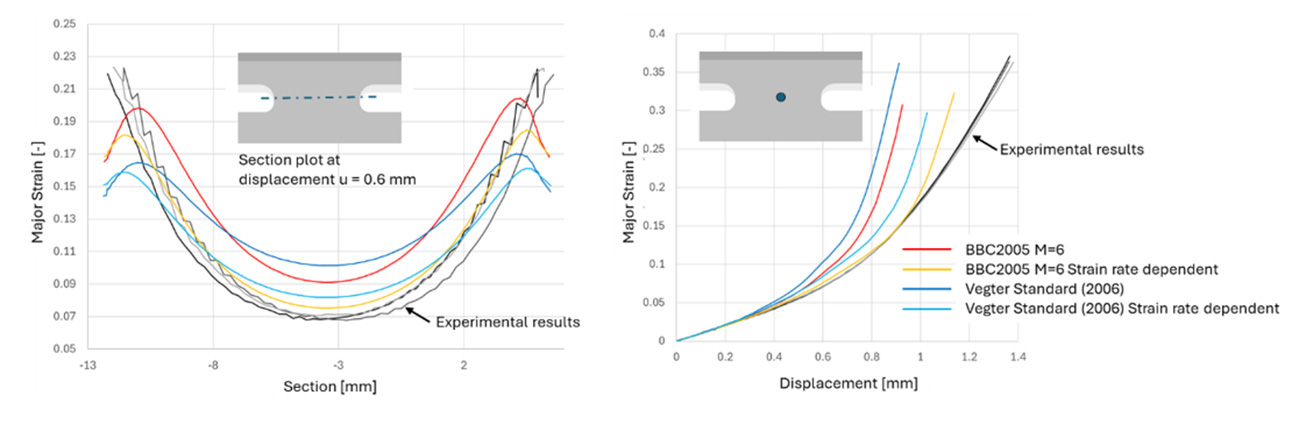
Figure 7: Section plot and history plot of plane strain sample for major strain
Reality Check: Experiment vs. Simulation
With the material card in place, we simulated it on the MUC test (Material Under Control)—a stretch‑draw benchmark developed at the Chair of Metal Forming and Casting (utg), Technical University of Munich. By varying the blank size, the test deliberately covers different strain states. Friction was modeled with TriboForm: using tool surface roughness, lubrication level, and a foiled punch, we built a dedicated friction card. For the benchmark submission, we reported the strain distribution in two cross‑sections and the punch force evolution for three blank sizes.
Blind benchmarks always come with a tense waiting period: you submit your best prediction first, and only later do you see the experimental truth. Figures 8 to 11 compare the measured response (blue) with the AutoForm simulation (red). Overall, the agreement was good, with one noticeable exception: the 70 mm blank showed a small strain mismatch. The post-simulation study indicates that an optimized friction card could have reduced this deviation further (yellow).
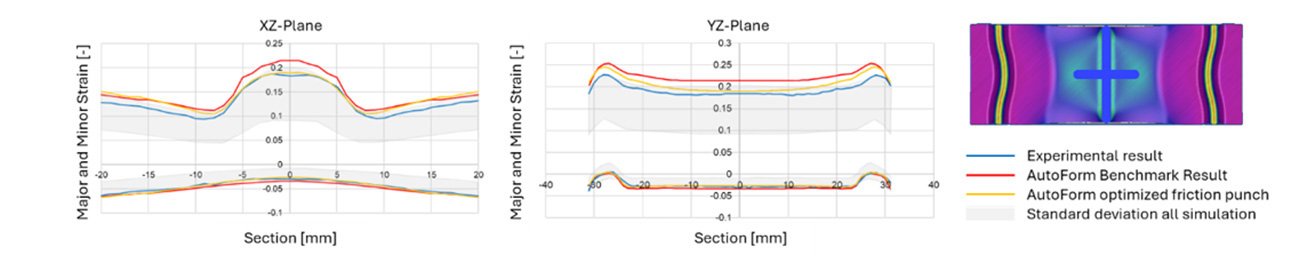
Figure 8: Experimental and AutoForm strain result of MUC-Test 70 mm 45° to rolling direction
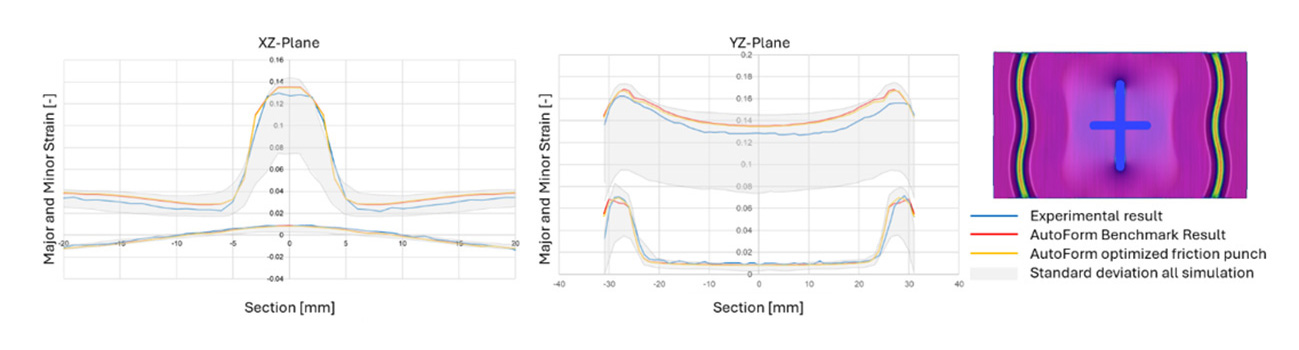
Figure 9: Experimental and AutoForm strain results of MUC-Test 110 mm 90° to rolling direction
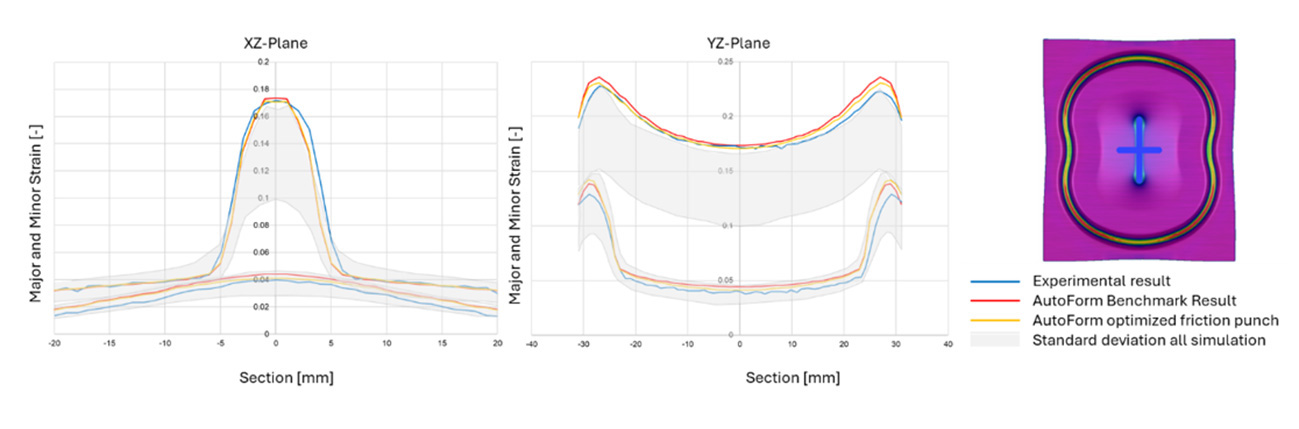
Figure 10: Experimental and AutoForm strain results of MUC-Test 230 mm in rolling direction
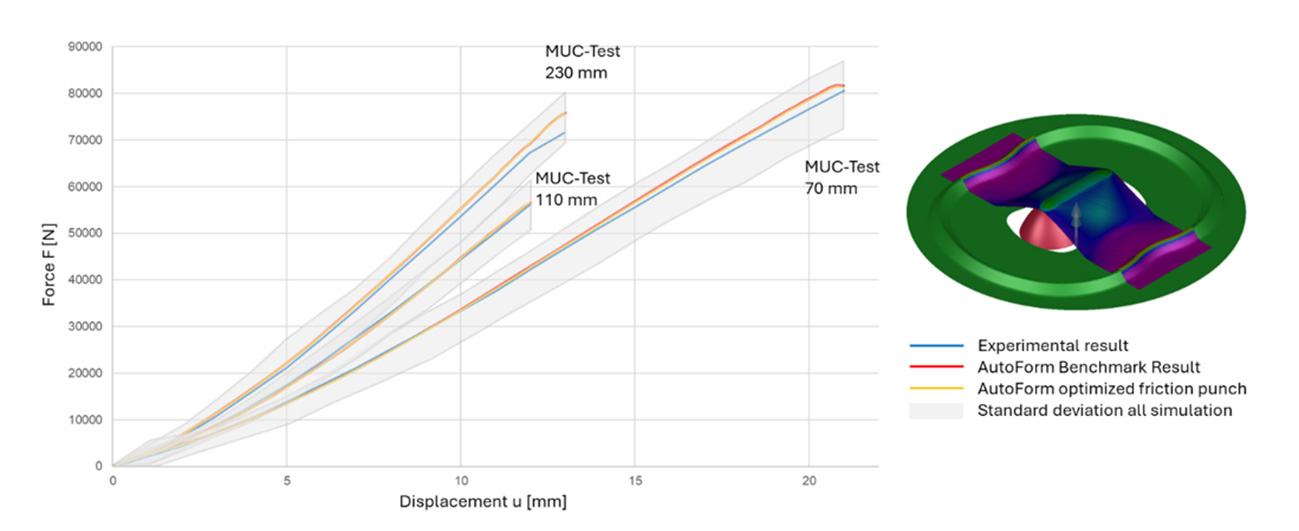
Figure 11: Experimental and AutoForm Force-Displacement curves
Benchmark Result: 1st Place Out of 17 Teams
In total, 17 international teams from industry, academia, and software development took part in the benchmark. As a blind study, all participants had to submit their best predictions before the experimental data was disclosed: punch force and major/minor strains in two evaluation sections for three different MUC tests (varying blank size and rolling direction). The score (“error value”) was calculated from the deviation between simulation and experiment; the exact definition is given in [3]. Figure 12 summarizes the results. As in the Industrial Benchmark, AutoForm achieved first place.
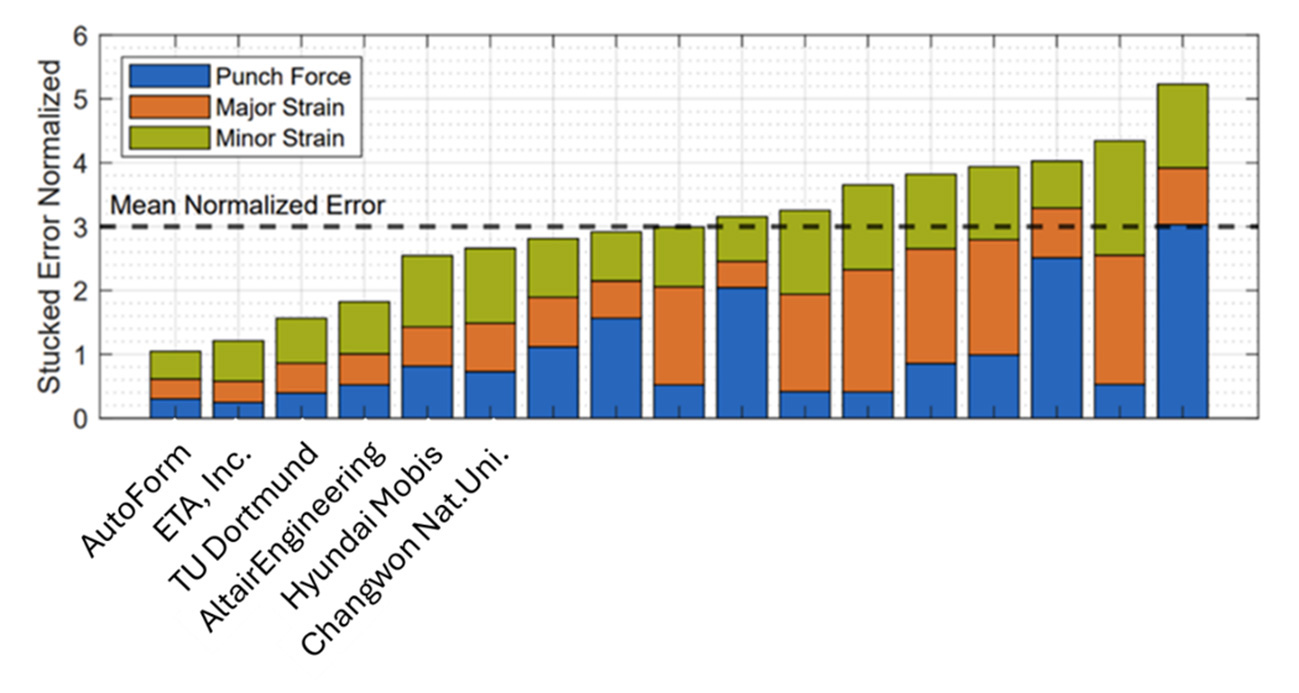
Figure 12: Mean error value of the 17 benchmark participants with the corresponding standard deviation versus the experimentally determined data.
Summary
For the Numisheet Scientific Benchmark 2025, we developed and validated a DP800HHE material card in AutoForm to predict punch forces and strain distributions in a blind benchmark. The model was calibrated using key tests that constrain hardening, anisotropy, and the yield locus (including bulge support beyond uniform elongation and a reverse‑engineered plane‑strain fit), and then validated on the MUC stretch‑draw test with a TriboForm friction card. In the final ranking, AutoForm placed 1st out of 17 participating teams.
This concludes part two of a two part series. See how AutoForm won the Numisheet Industrial Benchmark 2025 in part one.
See the full whitepaper to review the NUMISHEET results in detail.
References
| [1] | Maier, L., Walz, E., Hofmann, M., Rebelo Kornmeier, J., Juan, R., Junhe, L., Maawad, E., Volk, W., Hartmann, C.: A scientific benchmark for elasto-plastic constitutive modeling – part i: Micro- and macroscopic experimental data set and benchmark problem. Preprint (2025) |
| [2] | DIN EN ISO 16808: Metallische Werkstoffe – Blech und Band – Bestimmung der biaxialen Spannung/Dehnung-Kurve durch einen hydraulischen Tiefungsversuch mit optischen Messsystemen (ISO 16808:2014); Deutsche Fassung EN ISO 16808:2014 |
| [3] | Maier, L., Walz, E., Hofmann, M. et al. A scientific benchmark for elasto-plastic constitutive modeling – Part II: blind predictions, calibration strategies, and benchmark results. Int J Mater Form 19, 17 (2026). https://doi.org/10.1007/s12289-026-01984-1
|


?")


