
Stamping is one of the most frequently used manufacturing technologies in automotive and packaging industries because of short lead times and cost efficiency. When it comes to modern sheet metal forming, friction is more than just a background variable; it can literally make or break a stamping operation.
From different tool surfaces and sheet topographies to lubricant types and process variables, many variables create a wide range of friction behaviour, even within a single forming operation. And as any experienced stamping engineer knows, tool finishing is rarely uniform, meaning that some areas of a tool contribute far more to material restraining than others.
Despite this, many teams still rely on generic friction values or overly simplified models, leaving both simulation accuracy and tooling performance below their true potential. AutoForm addresses this challenge by enabling engineers to model friction where it actually matters, turning friction from an assumed constant into a controllable design variable.
Why Zonal Friction Matters
Traditional friction models often treat the forming tool as a uniform surface, applying a single coefficient of friction across the entire tool. While this simplifies simulation setup, it fails to reflect how forming tools behave in reality. In practice, not all tool areas contribute equally to material restraining, draw-in, strain distribution, or thinning.
Industrial experience confirms this variability. Polishing and finishing of dies and punch surfaces are rarely uniform, with Sa roughness values ranging from 0.2 μm to over 2 μm within the same tool. Certain areas (such as die radii and transitional zones) are often polished to a much smoother finish, while internal flat areas may remain significantly rougher. These variations directly influence local friction conditions, affecting material restraining forces and overall drawability. Understanding which zones truly drive part performance is therefore critical.
Ignoring these nuances risks over- or underestimating restraining forces, leading to excessive trial-and-error during tool try-out, wasted development time, and avoidable quality issues in production.
A recent study conducted by Mondragon University in collaboration with AutoForm examined this challenge in detail, analyzing three industrial automotive components: a steel inner door, an aluminium fender, and a steel fender. The goal was to determine which areas of the forming tool have the greatest influence on material flow and forming outcomes.
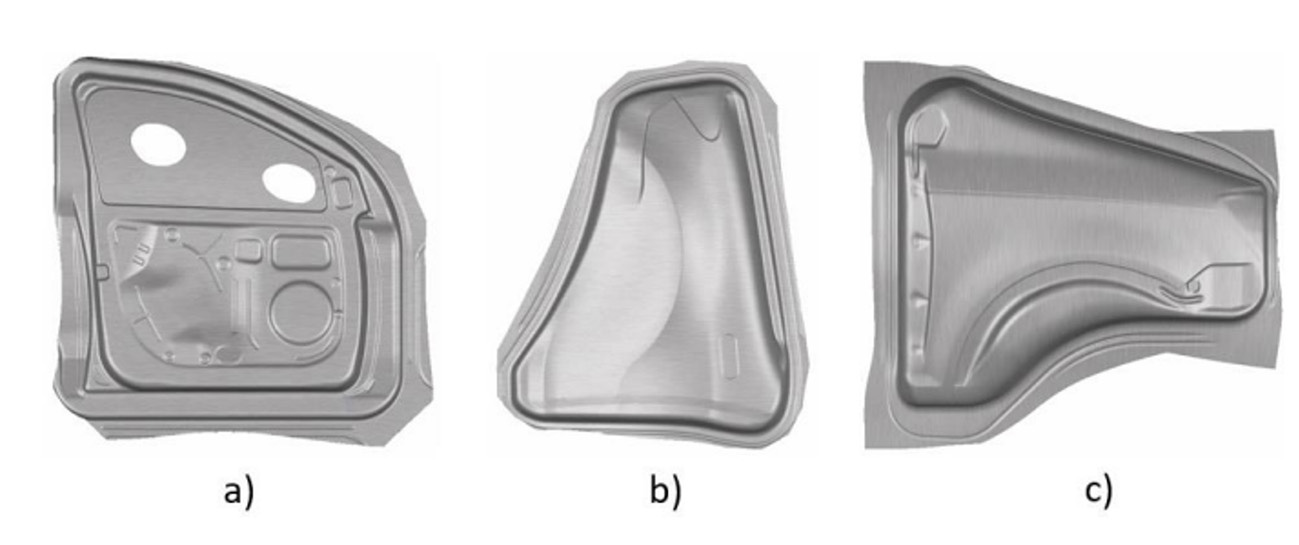
Figure 1 – Selected industrial components: a) steel inner door, b) aluminium fender and c) steel fender
Using TriboForm, the forming tools were divided into predefined regions—BinderFlat, Drawbeads, Die Radius, Internal Flat, and Internal Curved areas—and friction was applied selectively to each zone rather than uniformly across the entire tool.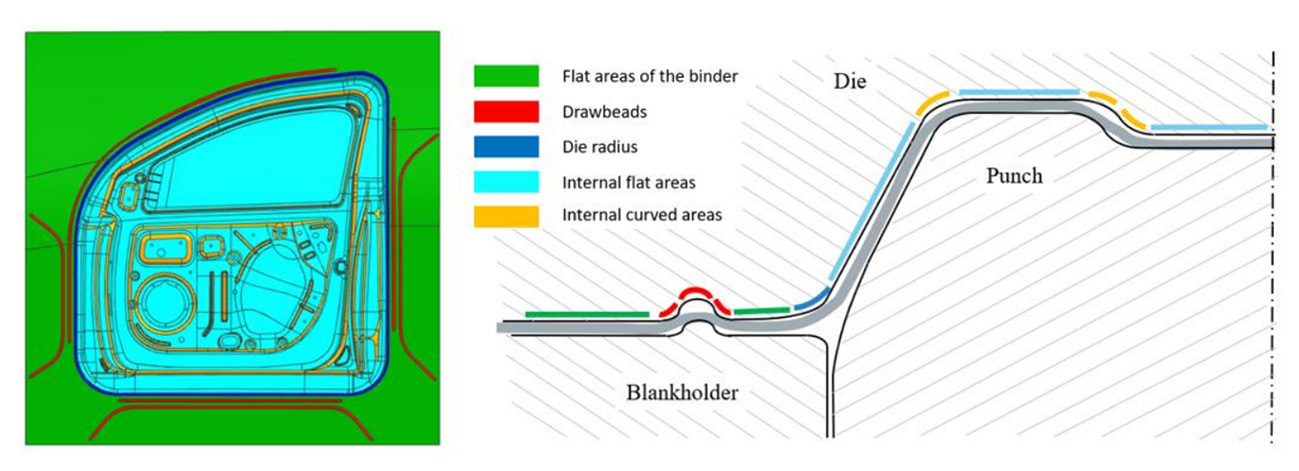
Figure 2 – Schematic representation of the main areas of the drawing tool and example of the division carried out for the steel inner door component
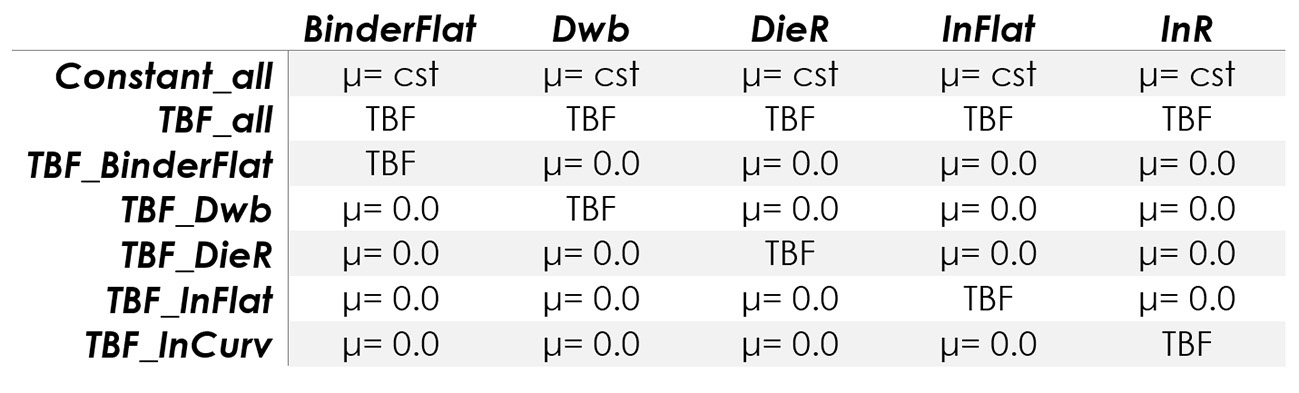
Seven simulation variants were run per component, ranging from frictionless conditions to friction applied individually in each zone, as well as full-tool friction models. By comparing these localized friction simulations with conventional constant Coulomb friction assumptions, the study revealed which tool regions are truly sensitive to friction effects, and which are not.
Table 1 – Variations with respect to the non-friction model
What Each Tool Zone Really Controls
The findings were clear: friction does not affect all areas equally. Detailed area-specific conclusions emerged that provide direct, practical guidance for tooling setup and finishing strategies:
Draw-in is mainly governed by internal flat and internal curved areas, making these zones critical for controlling material flow.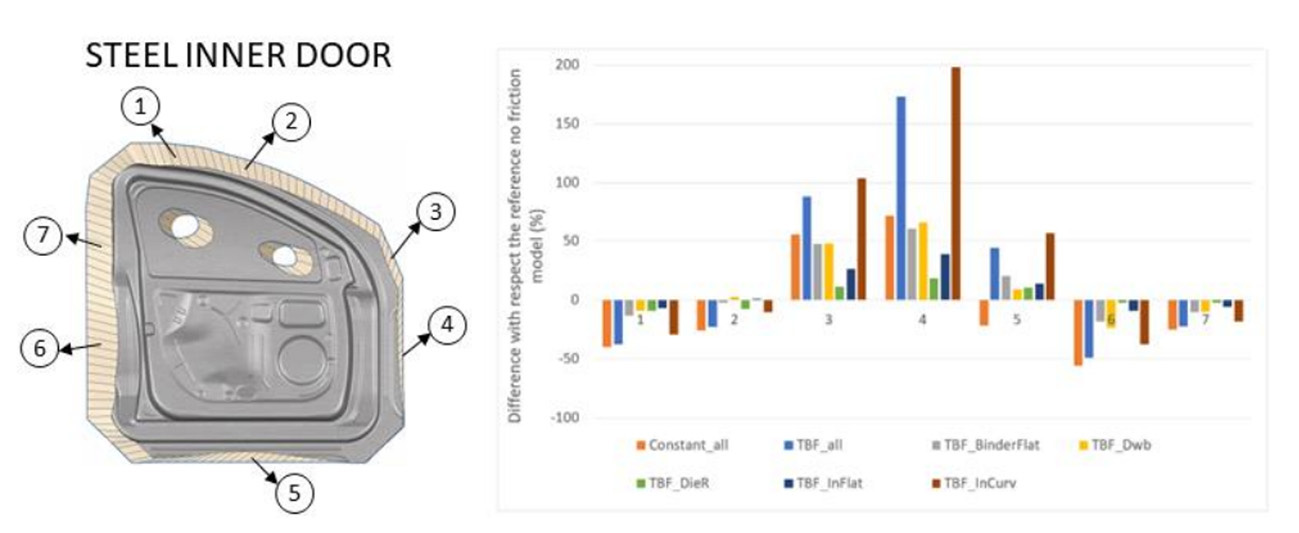
Figure 3 – Draw-in prediction for the steel inner door. On the left side, the draw-in field view under the reference case (no friction model). On the right side, the difference in draw-in is shown for each friction activated area.
Major strain is also dominated by internal flat and curved regions, particularly in large outer panels.
Thinning is most strongly influenced by binders and drawbeads, although its sensitivity varies more across components.
FLD-based drawability shows consistent behaviour for aluminium and steel fenders—where die radii, drawbeads, and binders dominate—while the steel inner door demonstrates a more distributed influence, with all tool areas contributing similarly.
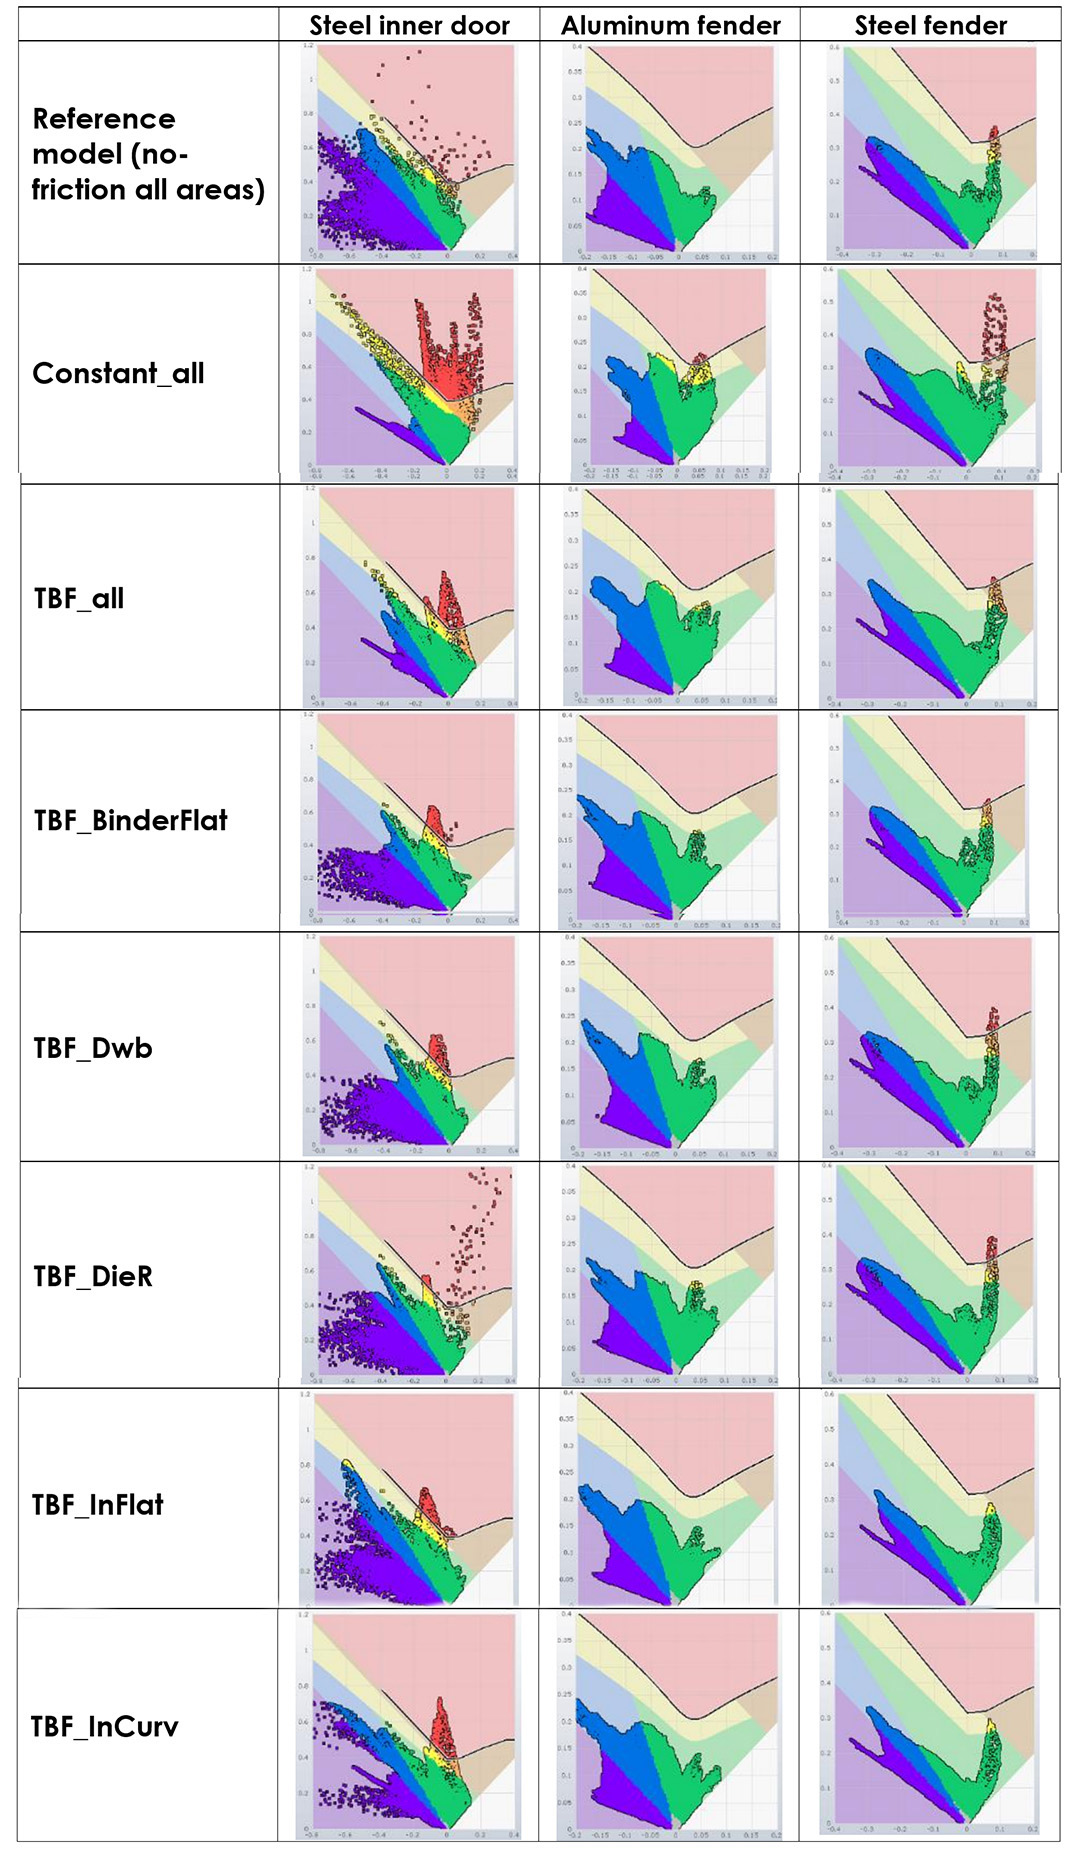
Figure 4 – FLD diagrams of the parts in which the FLC and the strain points in the major strain (y axes) and minor strain (x axes) are represented
These distinctions explain why blanket polishing or uniform friction assumptions often fail. Instead, targeted interventions in high-impact zones can deliver the same—or better—results with significantly less effort.
Zonal friction modelling enables engineers to work smarter, not harder, extracting more value from both their simulation tools and their production processes.
Component-Specific Insights Matter
While common trends were observed, the study also highlights that friction sensitivity is strongly influenced by component geometry and material choice. In other words, there is no universal friction strategy that applies to every part. For example, aluminium and steel fenders exhibited similar behaviour, with friction in die radii, drawbeads, and binders dominating formability outcomes.
In contrast, the steel inner door showed a more evenly distributed sensitivity, where all tool areas contributed to increases in major strain. This reinforces a key point for stamping engineers: reliable results require simulation strategies tailored to each component, not generic assumptions carried over from previous projects.
How Simulation Helps You See What Matters
The methodology behind the study illustrates how engineers can use advanced simulation to prioritize interventions:
Component and Material Selection: High draw-in components and materials with lower mechanical properties were chosen to maximize sensitivity to friction effects.
Zonal Differentiation of Tooling: Tools were divided into key regions—internal flat areas, curved surfaces, die radii, drawbeads, and binders—to assess individual friction contributions.
Friction Activation/Deactivation: Simulations alternated friction in each zone while keeping other areas frictionless. Seven variations were tested per component.
Analysis of Key Metrics: Draw-in, major strain, thinning, and material formability (via Forming Limit Diagrams, or FLDs) were measured to quantify each zone’s impact.
This approach allows engineers to see which areas of a tool truly govern material behaviour, providing actionable insights for polishing, tool design, and maintenance.
Key Insights for Stamping Engineers
Internal flat and curved areas primarily influence draw-in. Polishing these zones can significantly improve accuracy when comparing experimental results with simulations.
Die radii, drawbeads, and binder areas dominate strain distribution, particularly in fender components. Paying attention to these zones ensures better material formability.
Component-specific differences matter: while some trends apply across parts, the steel inner door showed that all areas contributed similarly to major strain, highlighting the need for tailored strategies.
Targeted tooling improvements (whether geometry adjustments, polishing, or surface treatments) can be applied only where they matter most, saving time and cost while improving performance.
The ability to detect high-impact zones allows engineers to act more intelligently. Early-stage tool design might focus on geometry modifications, while later-stage finishing might prioritize polishing or milling only where it has measurable effects.
Suppliers and OEMs can use this information to anticipate maintenance requirements, reducing unexpected downtime and enhancing tool longevity.
Bridging Simulation and Reality
One of the biggest challenges in stamping is the disconnect between simulation and shop floor results. Traditional friction models often fail to capture the nuances of real tools and materials, leading engineers to rely on costly trial-and-error during tryout.
Our approach, particularly using TriboForm for advanced surface roughness and friction analysis, addresses this gap:
1 It allows simulation with realistic, variable friction models drawn from measured or library-based data.
2 It enables zonal application, showing exactly which areas of a tool drive material restraining.
3 It quantifies effects on draw-in, thinning, and strain, giving engineers a clear roadmap for intervention.
By integrating zonal friction analysis into your workflow, teams can not only improve part quality but also save engineering time, reduce trial-and-error, and protect both internal and external reputations.
The Commercial Advantage
For stamping operations, this level of insight translates directly into measurable business benefits:
Optimized tool finishing: Focus resources where they create the biggest impact, improving product quality without unnecessary polishing or tooling changes.
Reduced tryout time: Fewer iterations are needed when simulations align with real-world behaviour.
Extended tool life: Maintenance and surface treatments can be planned for high-impact zones, reducing wear and downtime.
Improved OEM relationships: Accurate, predictable results strengthen confidence in engineering teams and suppliers alike.
AutoForm’s tools, particularly TriboForm for advanced surface roughness and friction analysis, are designed not just to simulate stamping processes, but to integrate friction insight directly into engineering workflows. By focusing on the zones that truly matter, teams can work more efficiently, reduce risk, and unlock the full value of their forming operations.


?")


