
1. Introduction
Press forming tasks have been increasingly difficult in recent years due to advanced automobile designs and the use of high-strength materials for weight reduction. To form a panel without defects in the same prototyping period as before, it is necessary to improve the quality assurance level by utilizing the high-accuracy press forming simulation at the digital phase. This paper describes a case study in which the accuracy of draw-in amount predictions is improved by applying high-accuracy friction coefficients to AutoForm, and how this leads to an improvement in accurately predicting dimensions of a press-formed panel.
2. Relationship between Accuracy of Predicting Dimensions and Draw-in Amount
Broadly speaking, quality requirements for the press forming include “dimensional quality” that affects the accuracy of white-body assembly and “surface quality” that influences appearance of a finished product. In the digital phase prior to creating an actual tool, the press forming simulation is used to ensure the dimensional quality and the surface quality. Then, in the tool creation phase, the quality ensured by the simulation must be reproduced on the actual tool. One of the important quality indicators is “the amount of draw-in” while the sheet is being drawn (hereinafter called “draw-in amount”).
In the press forming, it is a prerequisite to match the draw-in amount between the actual tool and the simulation in order to properly handle elongation. If the draw-in amount is not consistent, the defects that were not predicted by the simulation may occur on the actual tool.
In reality, however, the draw-in amount predicted in the simulation often do not match the draw-in amount on the actual panel at the first tryout. So the actual tool must be adjusted to the predicted draw-in amount. Matching the draw-in is not an easy task, and it usually requires a lot of man-hours.
It is often the case that the draw-in amount cannot be fully matched, causing the dimensional accuracy of the panel to deviate significantly from the prediction. As a result, the tool must be compensated once again.
Figure 1 illustrates the change in springback when a friction coefficient is intentionally modified to alter the draw-in. Differences of 0.5 – 1.0 mm are seen in the punch.
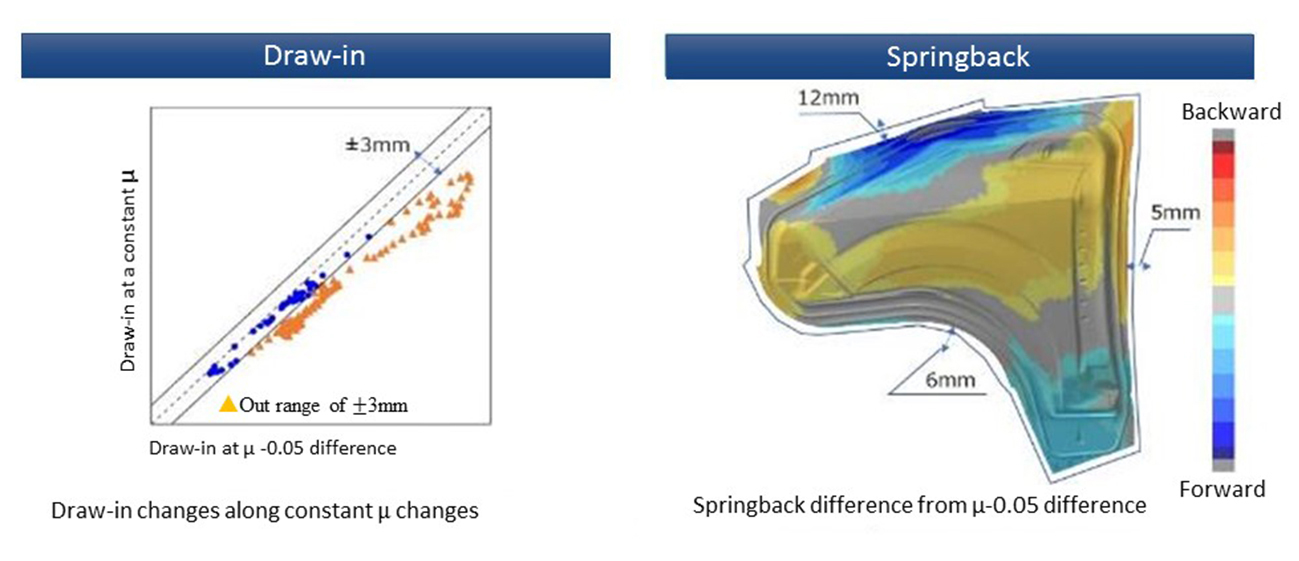
Figure 1. Difference in springback amount due to altered draw-in
3. Sliding effects that Alters Draw-in
The problems caused by the mismatch of draw-in between the simulation and the actual panel are discussed above. To analyze the factors, we identified the 4 Ms (Material, Man, Machine, Method) related to the draw-in amount, and examined the factor diagram (Figure 2). By assuming the factors, we found that the “sliding effect” may have a large impact on altering the draw-in.
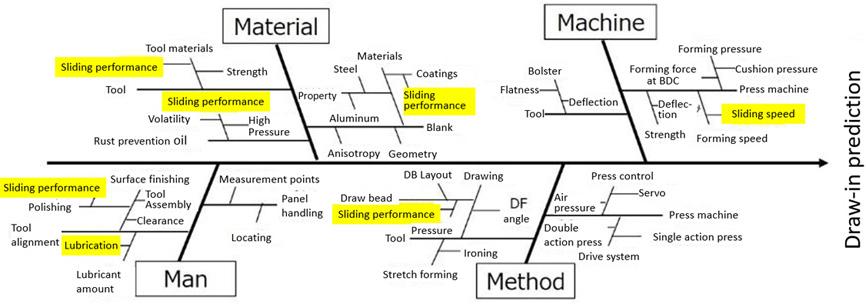
Figure 2. The factor diagram for prediction of the draw-in amount
Conventionally, the press forming simulations have been performed with a constant friction coefficient. It is based on Amontons-Coulomb Law, which is commonly used in press forming simulations, and the average of laboratory test results are used to run the simulations (Figure 3).
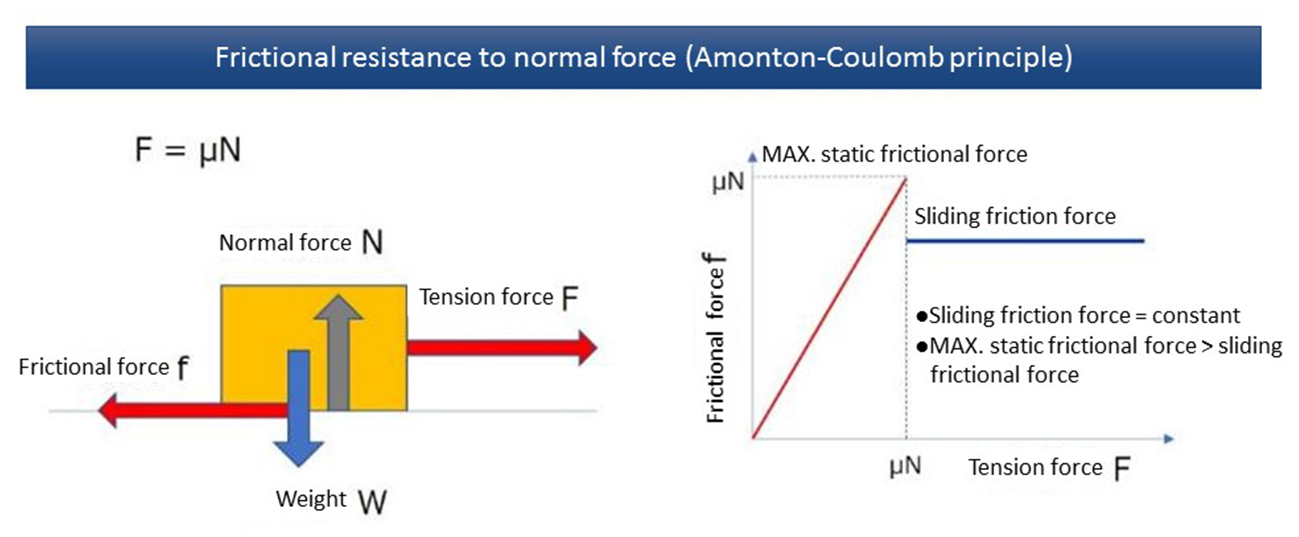
Figure 3. Relationship between frictional force and tensile load
Strictly speaking, there are known phenomena such as load dependency of the friction coefficient as described in “Breakdown of Amontons’ Law“2) by Ohtsuki and Matsukawa et al., and velocity dependency of the friction coefficient as with the commonly known Stribeck curve due to the differences in lubrication conditions.
Analyzing the press forming again from this perspective, differences in the pressure distribution can be seen even inside the bead shape which controls the draw-in amount. Since the forming speed also accelerates along with the press motion, it can be assumed that the friction coefficient happens to change as well (Figure 4).
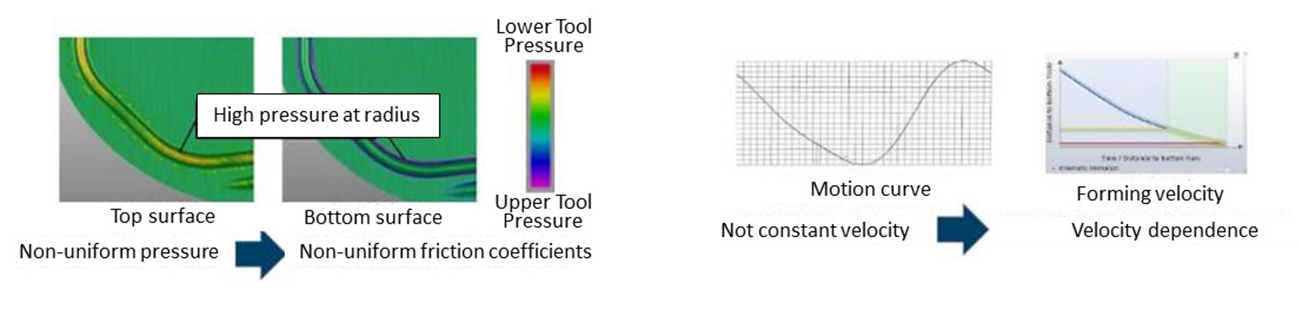
Figure 4-a. (left) Pressure distribution
Figure 4-b. (right) Forming speed
In order to predict the draw-in amount accurately using AutoForm, the higher-order friction coefficients should be applied, with the load and the forming speed as variables, rather than using the constant friction coefficient.
Higher-order friction coefficients can be set easily with TriboForm. The factors that determine the friction coefficient include contact geometry, contact pressure, material type, surface roughness, and amount and type of lubrication. TriboForm’s standard MAP takes these factors into account 1), and allows for high-accuracy friction simulations. Nonetheless, since our friction conditions could not be fully reproduced, we have taken steps to further improve the accuracy.
4. Friction Experiment to Measure Friction Coefficient
To clarify the effects of pressure and velocity on the friction coefficient as described above, we had an experiment to measure the friction coefficient.
Considering that Young’s modulus and Poisson’s ratio differ among tools and steel grades, it is important to reproduce the actual combination of the tool and the steel in use, so we prepared the experiment device as shown in Figure 5 and measured the friction coefficient.
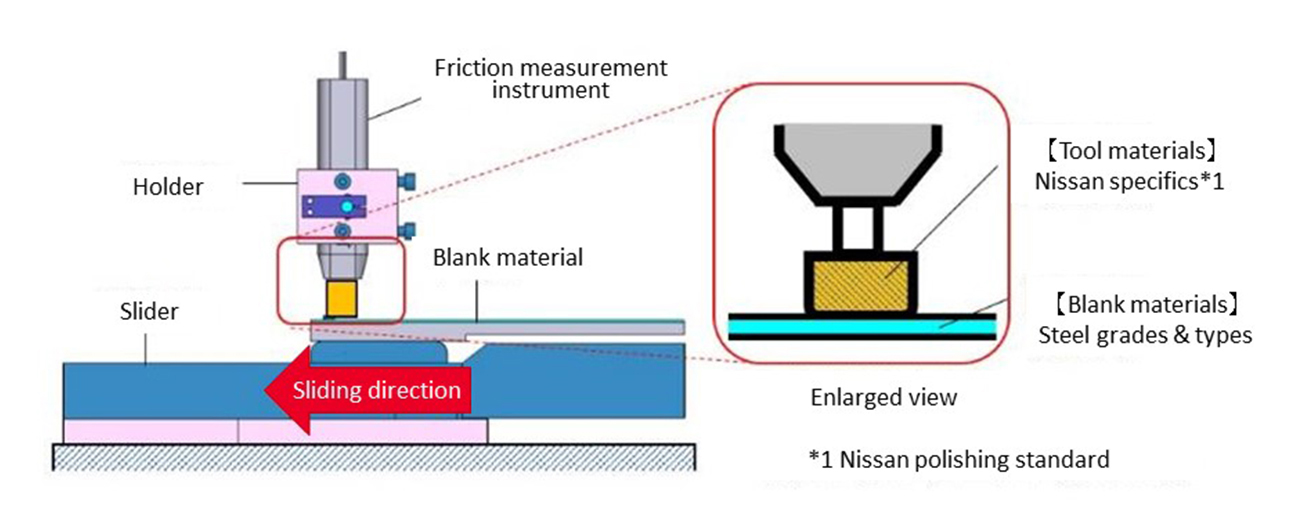
Figure 5. Experiment device
The sliding velocity of the experiment device is set to be variable, and the velocity is changed to verify the dependency on velocity. The dependency on pressure is also verified by changing the press load.
The measured values are reprocessed to calculate the friction coefficients for each pressure and velocity (Figure 6).
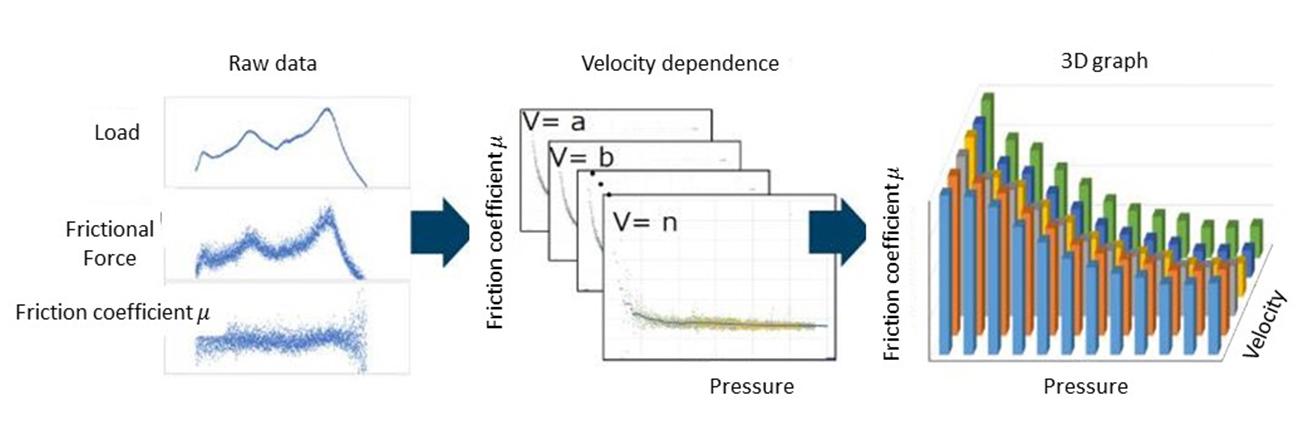
Figure 6. Friction coefficient / pressure-velocity graph
5. Applying Higher-order Friction Coefficients to Simulation
The friction coefficients are mapped into a 3D graph and imported to TriboForm. A sliding analysis is performed on a model that simulates the tool surface and the surface of a steel sheet to calculate how surface roughness changes while being pressed. Since the projection height changes accordingly, the resulting change in conditions of the boundary with the oil surface is also calculated 1). The results are converted into a continuous 3D friction map (Figure 7).
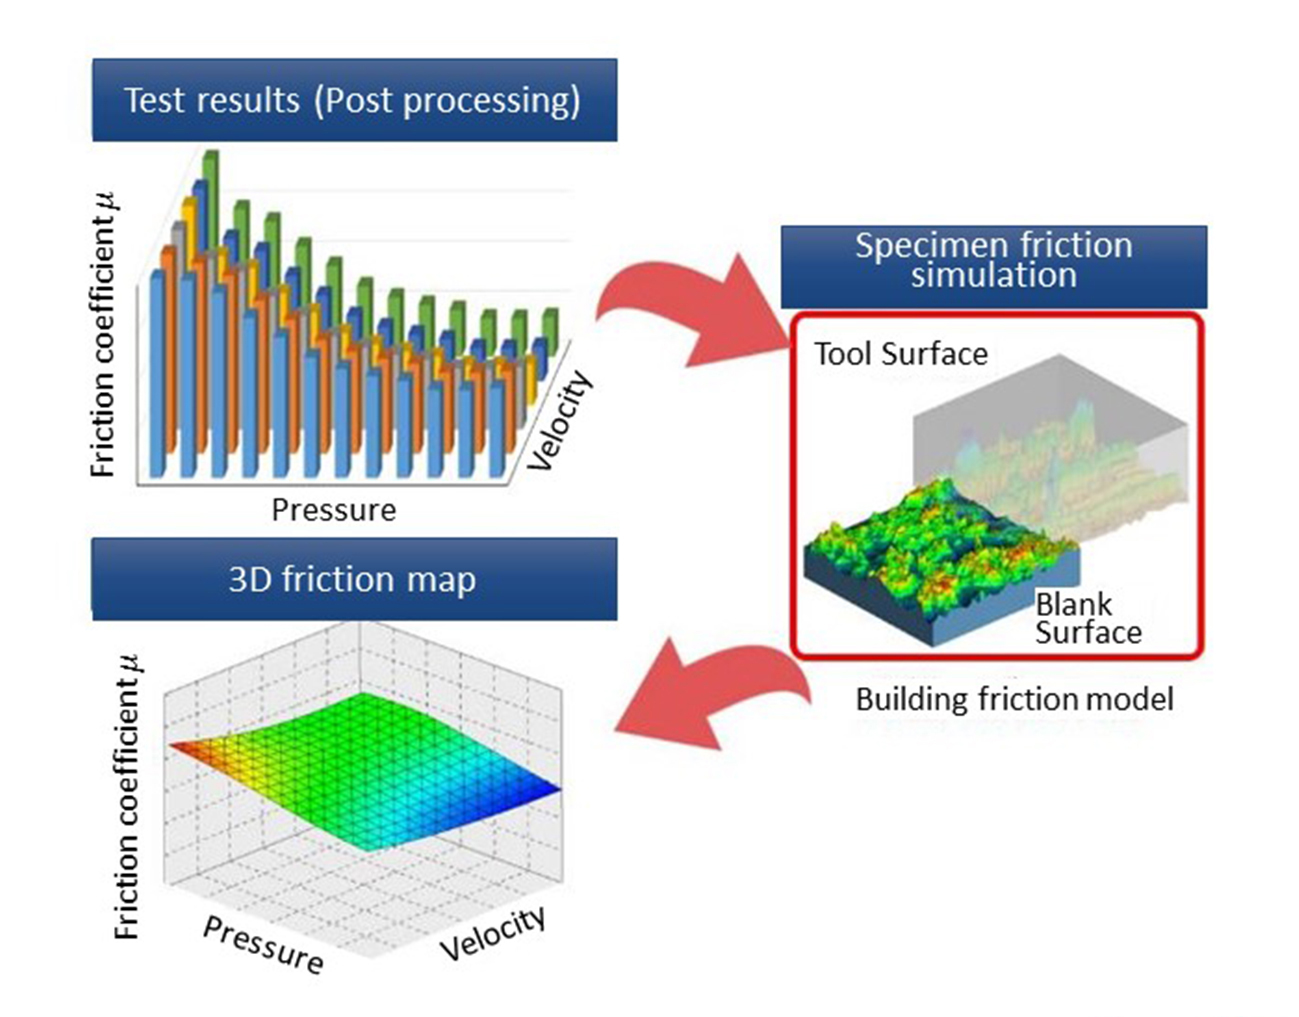
Figure 7. The 3D friction map
The friction coefficients obtained above are applied to AutoForm and the simulation result is shown in Figure 8.
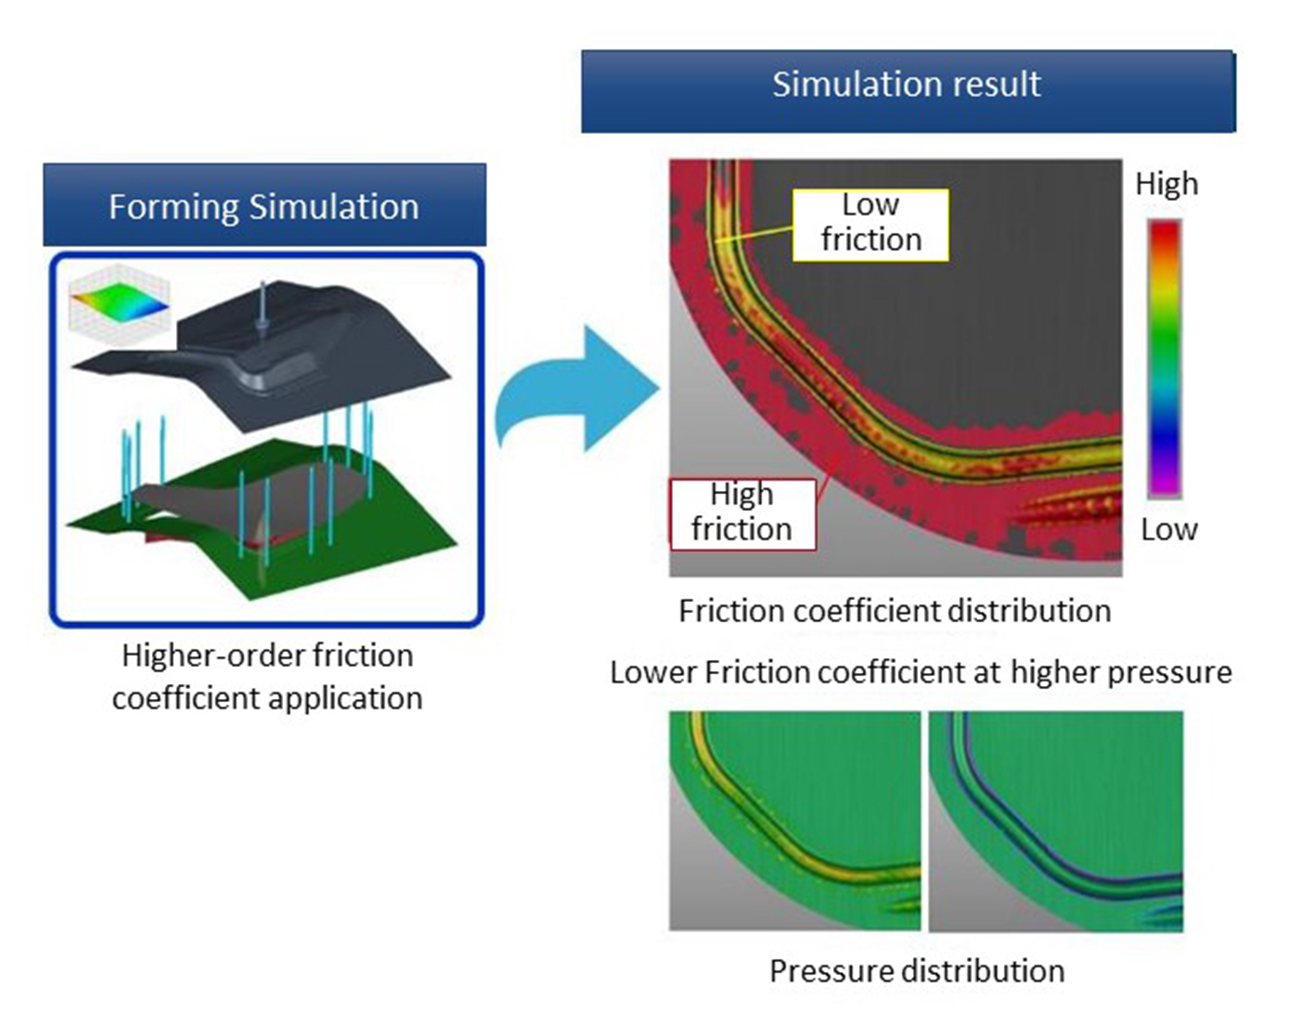
Figure 8. A result of the simulation with use of higher-order friction coefficients
As can be seen from the results, the dependency on pressure leads to the differences in heights of the friction coefficients, and the assumed behavior of the modified friction was successfully obtained.
The following shows how this method changes the result.
6. Utilizing Simulation to Improve Reproducibility
To verify the effect of the higher-order friction coefficients, we compared the draw-in amount and the dimensional accuracy of a panel with and without applying higher-order friction coefficient. A fender front with a hot-dip galvanized steel sheet is used (Figure 9-a,b).
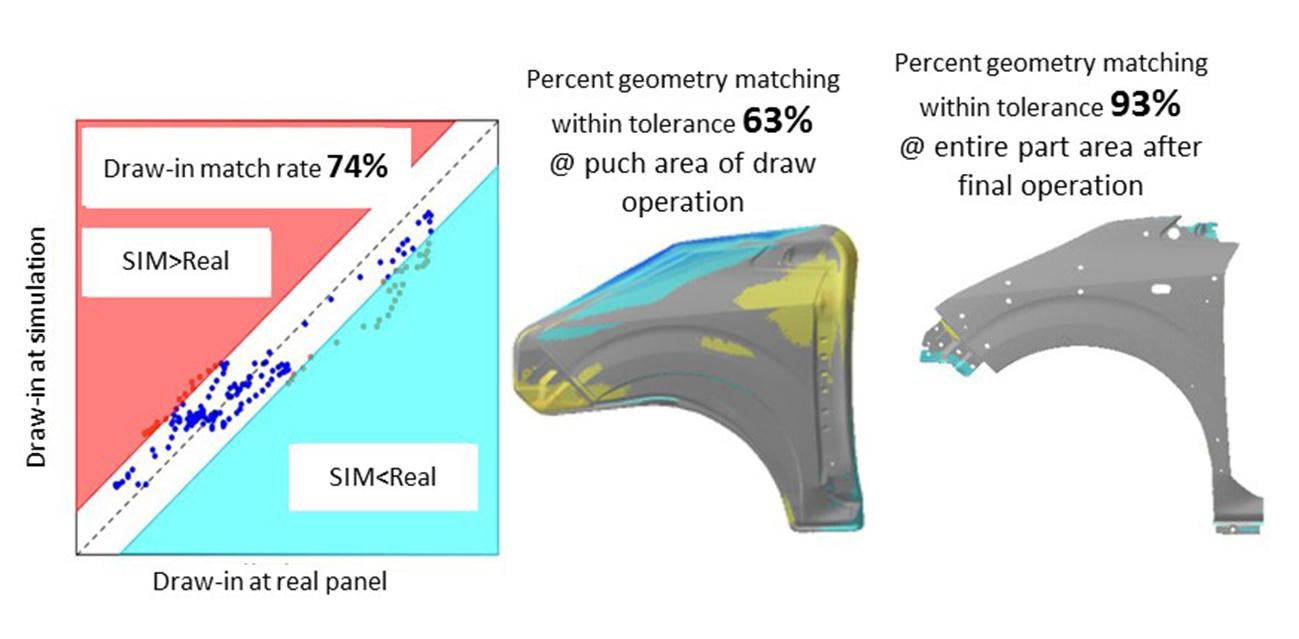
Figure 9-a. Result of analysis with use of the constant friction coefficient
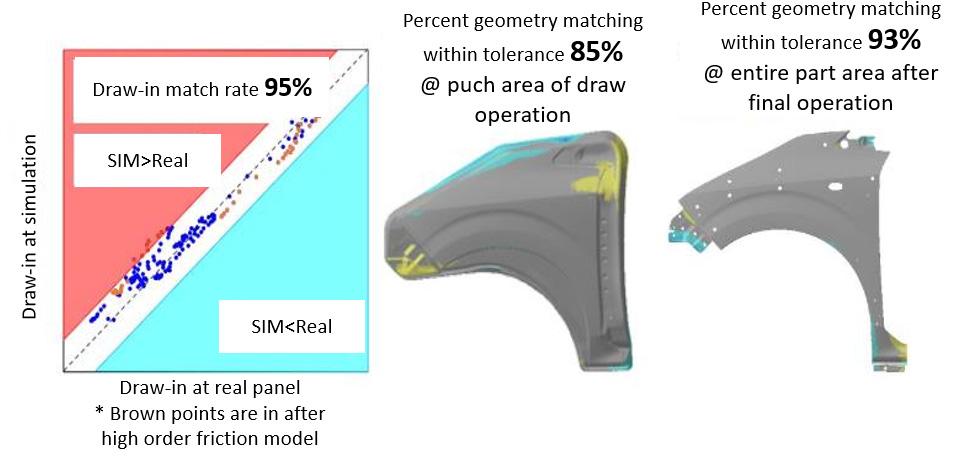
Figure 9-b. Result of the analysis with use of the higher-order friction coefficients
The draw-in match rate is improved by 21% after applying the high-accuracy friction coefficients. The dimensional accuracy of the panel is evaluated by comparing simulation results with data from non-contact measurement of the actual panel, with ±0.5 mm difference in the shape match rate. The shape match rate inside of the punch in the draw operation is also improved by 22%. The result of the finished panel is nearly identical.
7. Summary
The result presented here is just one of many examples. The experiments with other steel grades and with aluminum sheet also show the similar results.
We learned that the application of high-accuracy friction coefficients is effective in improving the simulation accuracy. If the springback that occurs in the draw operation is consistent between the simulation and the actual panel, we can expect to shorten time to adjust the trim tool.
You may also like to read: “Nissan Optimizes Surface Defects with TriboForm! Accuracy Up by 20% – Detection Errors Cut by 10%.”
1)J. Hol et al.: Multi-scale friction modeling for sheet metal forming: The boundary lubrication regime: Tribology International (2014)
2)Michio Otsuki and Hiroshi Matsukawa: Local Slip at Friction Interface and the Breakdown of Amontons’ Law: Tribologist (2013)


?")


