
Series index. Part 1, Part 2, Part 3, Part 4, Part 5, Part 6
In the last decade, new generation grades have been introduced to the hot stamping world. Until recently, 22MnB5 was the standard material in most applications. However, new alloys provide more flexibility in the design of BIW parts. Some offer very high strength, used mainly for intrusion resistance (tensile strengths above 1800 MPa); examples include: Usibor® 2000, MBW®1900, Docol® 2000 PHS, phs-Ultraform® 1800, and BR1800HS. Other alloys offer lower tensile strength (under 1500 MPa) for crash energy absorption and deformed shape control by improved ductility and bendability, such as Ductibor®1000, Ductibor®500, MBW®1200, and BR1200HS. This wider variety of materials supports car makers in reducing weight and increasing crashworthiness.
In the past 3 years, we’ve observed an increasing interest in these materials for BIW applications, especially in the form of tailor welded blanks and patchwork blanks. However, process engineers have struggled to model the corresponding sheet metal behavior owing to a lack of knowledge regarding phase transformation of these alloys.
What’s so different about these new materials?
Compared to the standard 22MnB5, these new materials have different proportions of alloying elements. This in turn makes for distinct critical cooling rates, phase transformation and final hardness. So, to successfully model these materials, we need to incorporate the Continuous Cooling Transformation (CCT) diagram — a graph that reflects which types of phase changes will occur in a sheet metal part as it is cooled at different cooling rates. The information from the CCT diagram represents the “heart” of the material card, helping to calculate the final product properties depending on the process conditions.
Using this reliable new simulation technology, process engineers can optimally design, develop and industrialize the direct and indirect hot forming and phase transformation processes of all new generation alloys. They are now able to more accurately predict the issues they may experience in production such as splits, excessive thinning, wrinkles, etc. and calculate the hardness and number of metallurgical phases present in the final part. It is also possible to model different tailoring tempering methods that produce a mixture of bainite, ferrite, and/martensite to generate soft zones in the part.
To illustrate this new technology, the simulation of hot forming and phase transformation of a new generation alloy is shown in the study below. The material card contains the mechanical description at different temperatures and strain rates, while the CCT diagram shows the material’s phase changes at different cooling rates. A sample CCT diagram which can be implemented in a material card for simulation of direct and indirect hot forming processes is shown in figure 1. In the diagram, we can easily identify which phase changes (F: ferrite, P: pearlite, B: bainite, M: martensite) will occur in the part as it cools at different rates (vertical lines).
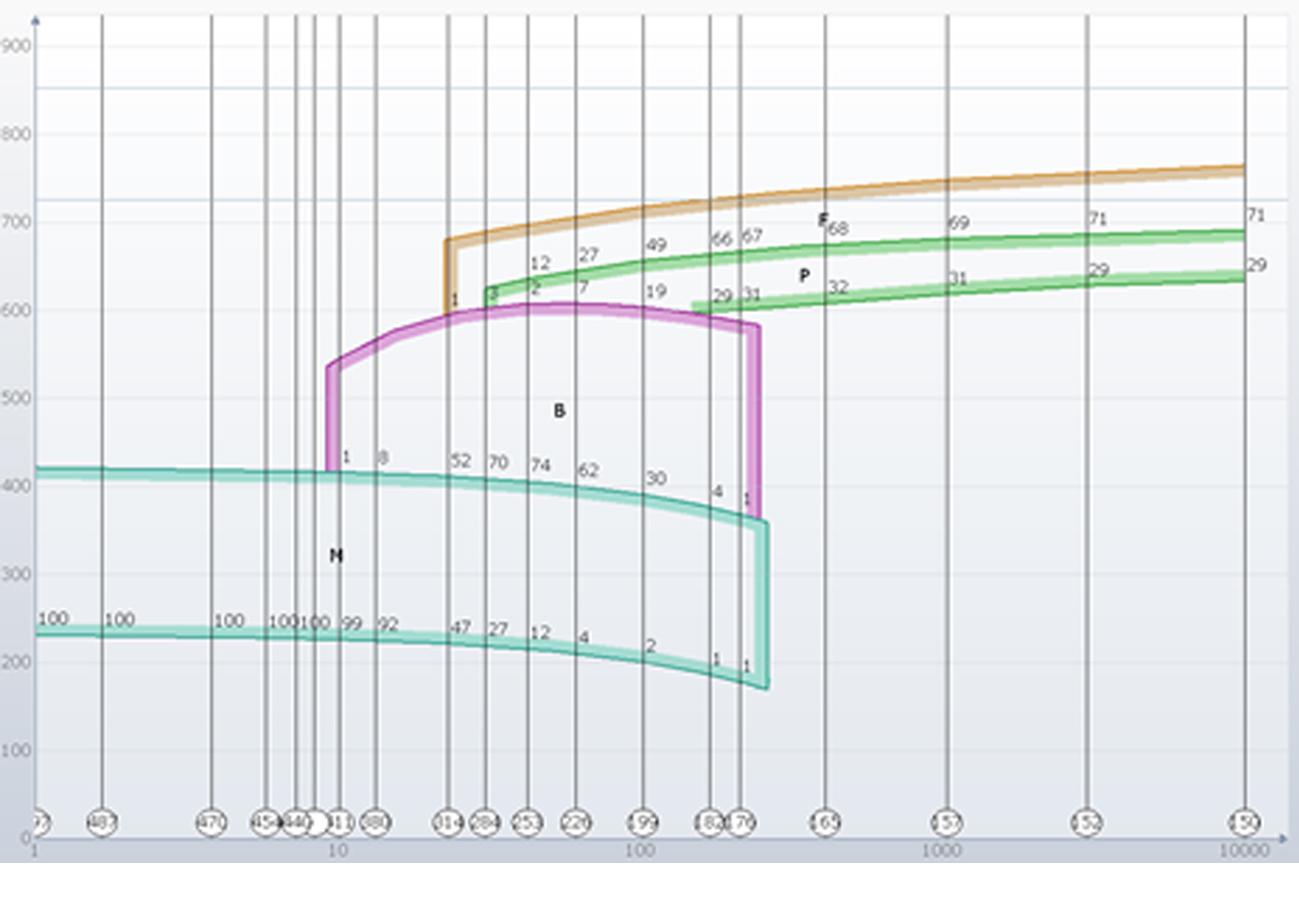
Figure 1 – CCT diagram of a sample hot stamping alloy
The presented case was based on a patchwork blank. The material of the patch used for the hot forming simulation was 1.00 mm thick with a final strength lower than 22MnB5. The temperature of the tool was 80°C and the initial temperature of the blank was 930°C, where a complete austenitization of the patchwork blank was achieved. The dimensions of the blank and the patch are shown in figure 2.
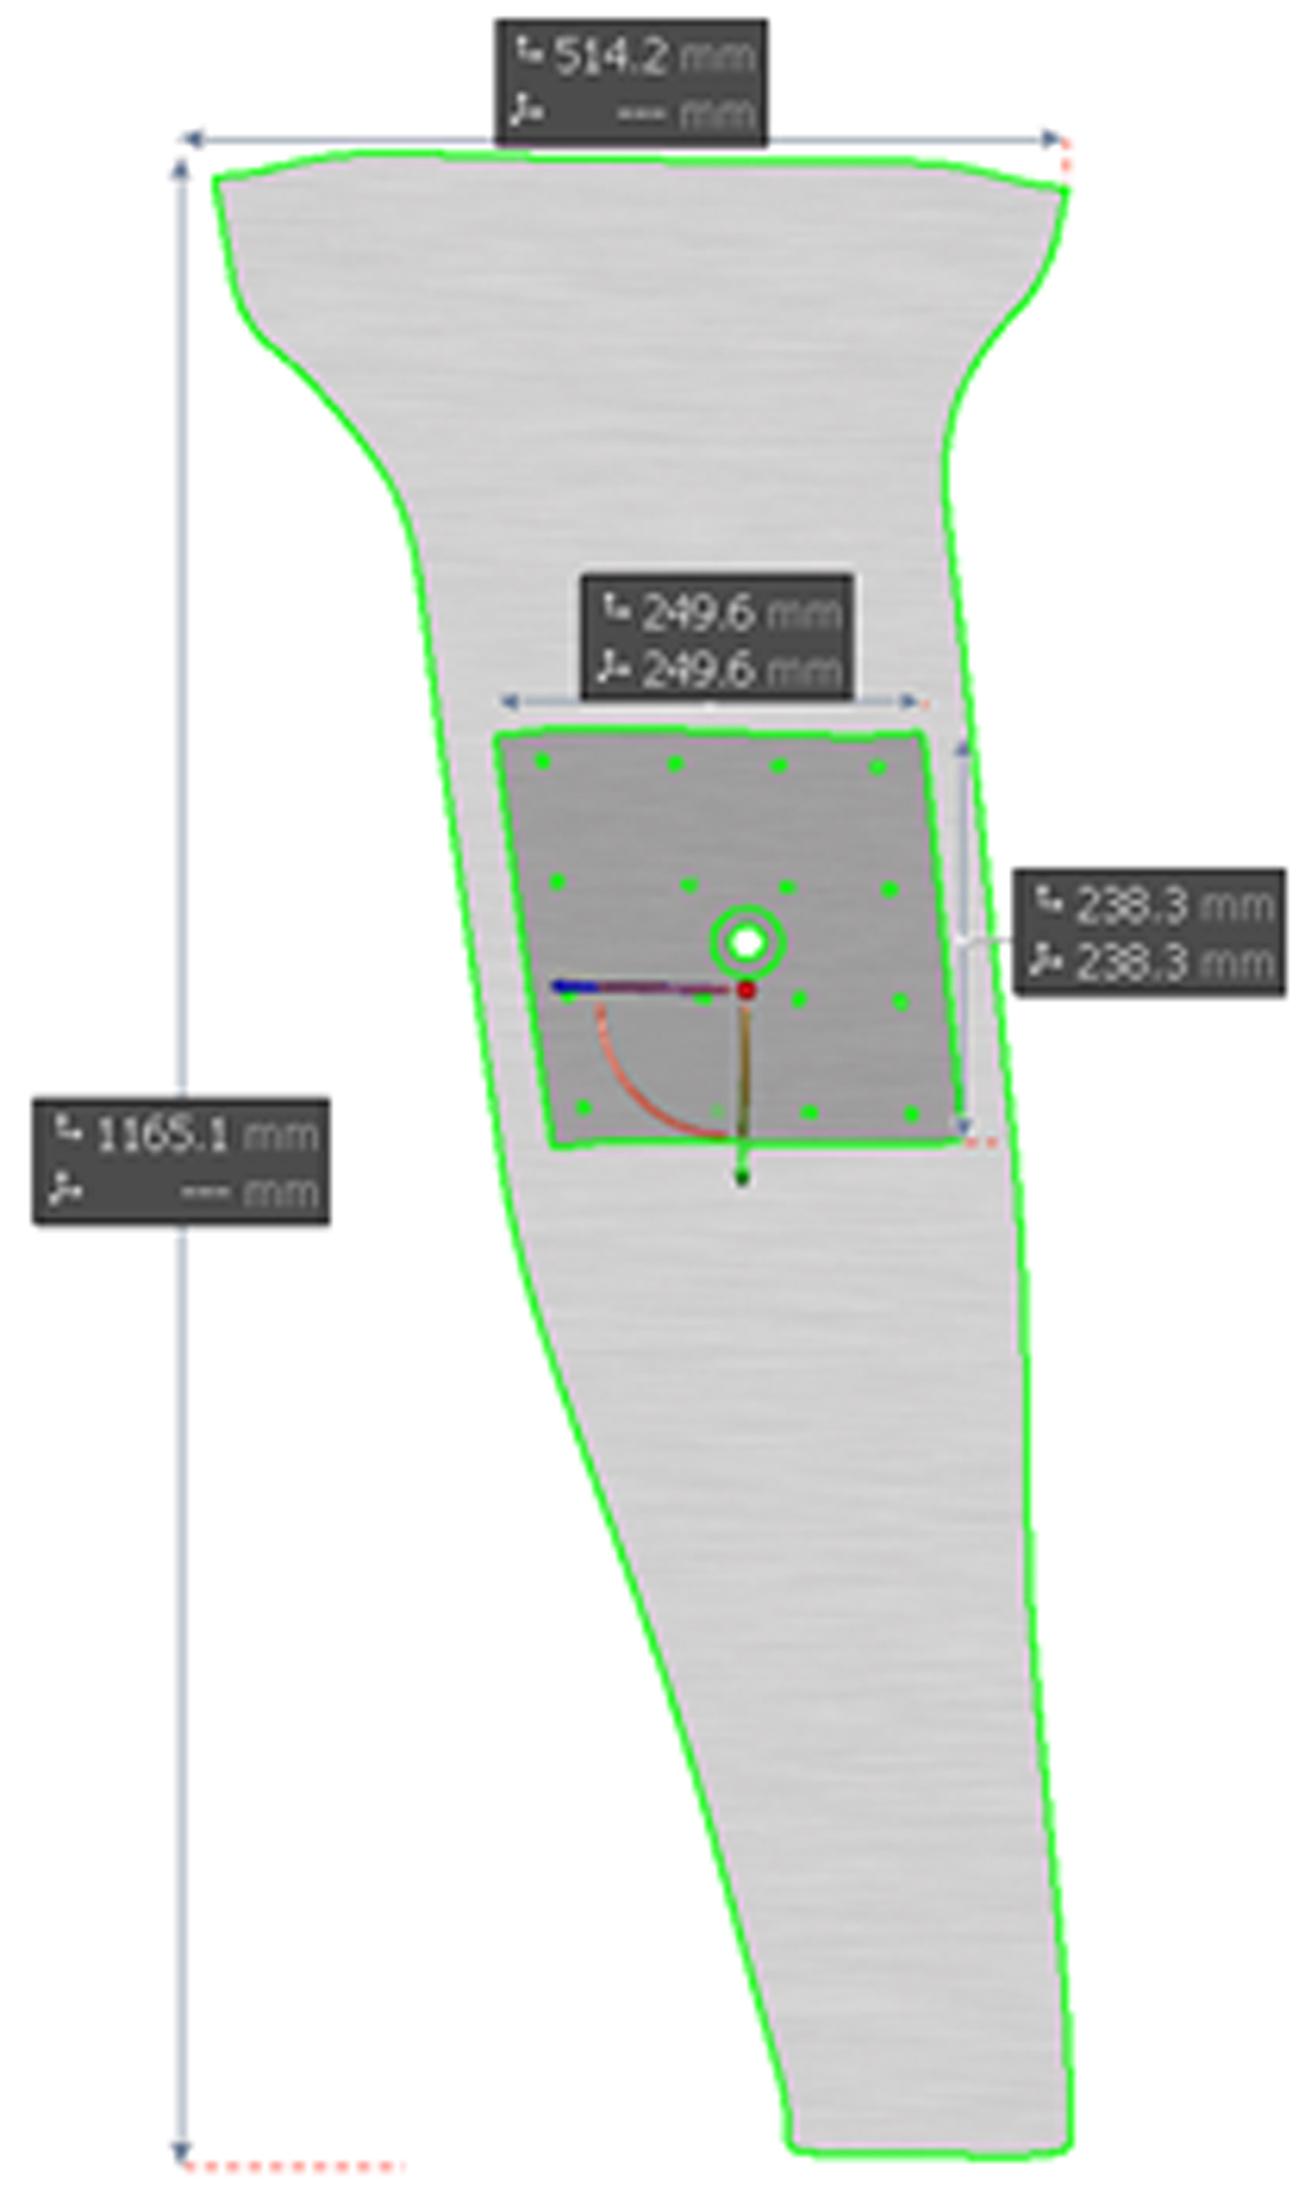
Figure 2 – Dimensions of the patchwork blank
The total cycle time (transfer, closure, quenching and withdrawal) was set to 19 seconds to obtain a hot formed part with a completely martensitic final microstructure.
The new generation alloy CCT diagram provided an accurate phase transformation for the hot forming process. Following, the part presented no risk of split or wrinkling according to the input parameters. The strength of the formed part was very high compared to the base material, with a tensile strength of approximately 1470 MPa and 1050 MPa for the substrate and patch respectively.
The simulation results in figure 3 show that 100% martensitic transformation was achieved in all areas of the part. However, the main blank and the patch exhibit different hardness values (approximately 480 and 350 HV for the substrate and patch respectively), as seen in the image on the right. This deviation is due to the material differences of the main blank and the patch.
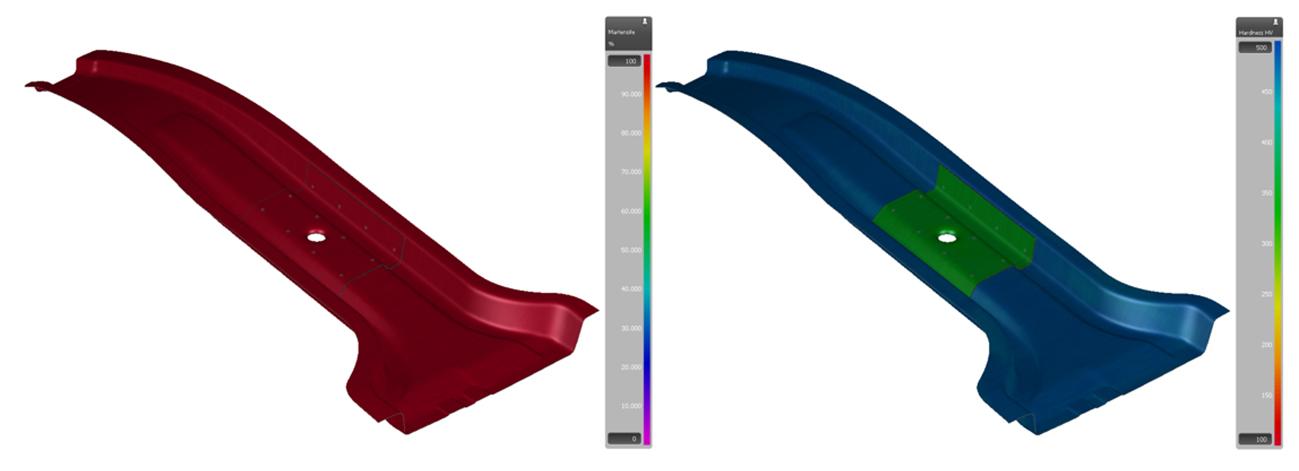
Figure 3 – (left) Martensite content and (right) hardness
Although the calculations that take place “under the hood” are very complex, using material cards is comparatively simple. Nothing changes in the workflow of a process engineer. They just need to select a material card, run the simulations, and evaluate the result as usual.
Using CCT diagrams to simulate the phase transformation of new generation alloys offers customers a reliable technology to examine part and process feasibility, optimize forming and production process parameters, and conduct final validation analyses. This provides a better insight into the effects of phase transformation and better control over the resulting mechanical properties of hot formed parts made from new generation alloys. In addition, this new technology allows customers to accurately calculate the final part properties, including real thickness distribution, resulting hardness distribution, and the distribution and local proportions of different metallurgical phases such as martensite, bainite, austenite, ferrite, and pearlite.
In part 2 of the series, we cover simulation approaches to the super plastic forming (SPF) process. Continue reading this series!


")


?")


