
Recent insights into extended capabilities of the tensile test
The uniaxial tensile test – inexpensive and conventional – generates valuable data for characterizing sheet metal behavior.
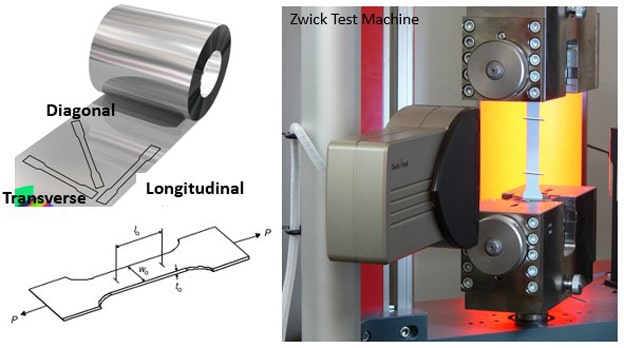
Fig. 1: Uniaxial tensile specimen and typical test set up
An important measurement provided by the tensile test is the hardening curve, or the stress-strain curve, which is crucial to building the material’s constitutive model for use in simulation.
Below is a plot of engineering stresses as a function of engineering strains, recorded from a tensile test for a grade of mild steel.

Fig. 2: Engineering stress-strain curve measured in a uniaxial tensile test
Uniform elongation (UE) is considered the practical limit of a material’s “formability”. It is the strain measured at the maximum stress sustained by the material, the ultimate tensile strength (UTS). Continued elongation of the material past UTS / UE is not a useful reserve of ductility; this deformation is associated with diffuse, and subsequently, local necking – where the specimen’s load carrying capacity decreases faster than the rate of it’s material strengthening.
The engineering stress-strain curve is easily converted to a measure of true stress-true strain; this is essential for representing the inherent (“true”) behavior of the material in simulation. Figure 3 shows the true stress-true strain curve until the converted UTS; the remainder of the curve is not useful, as mentioned earlier.
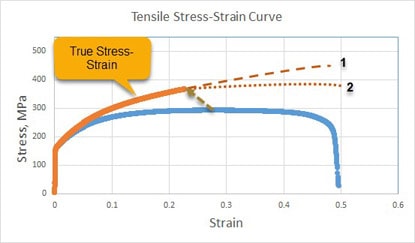
Fig. 3: True stress-strain curve
Now, it’s important to remember that the uniaxial tensile test represents just one deformation mode or load condition on the sheet metal. In complex stampings, different regions of the sheet will experience different deformation modes: biaxial (preforms, punch corners), plane strain (draw walls at the center of roof sides), and shear. The principle of equivalent work allows material behavior in these different deformation modes to be represented simply by the uniaxial stress-strain curve.
However, we know that biaxial deformation modes are capable of producing significantly higher magnitudes of useful strains and stresses than can be measured in a uniaxial tensile test. This means that the uniaxial tensile curve, represented by the thick orange curve in Figure 3, needs to be extrapolated to and beyond the stresses and strains experienced under biaxial deformation. What is the correct extrapolation – curve 1 or curve 2? Which of these represents inherent material behavior? The quality of this extrapolation depends on our choice of available constitutive models (Swift, Hocket-Sherby, etc.). This in turn will impact the accuracy of simulation outcomes.
Additional tests such as the hydraulic biaxial bulge are capable of producing stress-strain curves well beyond UE in a uniaxial tensile. The results of these tests are useful in selecting the correct constitutive model, and therefore improve the reliability of material representation for simulation. Bulge tests, however, are complicated, expensive to execute, and difficult to post-process; plus, they are not very widely available.
“What if the tensile specimen itself could be persuaded to produce more data than we usually get from it?” Excellent thought! Recent advances in DIC (Digital Image Correlation) measurement techniques applied to tensile testing appear to have enabled just that…
DIC techniques for more aggressive tensile evaluations have been advocated for and explored for more than a decade (IDDRG Plenary Lecture, T. B. Stoughton). Recent work by J. Chen et al. (J Chen et al 2019 IOP Conf. Ser.: Mater. Sci. Eng. 668 012013) represents similar investigations. More recently, this technique was employed in the tensile testing of aluminum and AHSS steel grades for the Numisheet 2020 Benchmarks at the NIST (National Institute of Standards and Technology, Gaithersburg MD). Details of the testing (conducted by Dr. Evan Rust of NIST), along with test outcomes, are described by T. B. Stoughton and J-W Yoon in the “Material Data Source” documentation accompanying material data for the above benchmarks.
In conventional tensile testing, only the movement of the ends of the specimen’s 50 mm gage length is tracked to compute strains and stresses and to build the stress-strain curve. This movement may be tracked using extensometers, or even using DIC. However, DIC offers the opportunity to explore the deformation of the tensile specimen more aggressively and up close. In the case of the tests executed at NIST, a dual-camera DIC system tracked the movement of a total of 201 individual points on the surface of the specimen, along the centerline of the it’s 50 mm gage. The points were 0.25 mm apart, representing the center of a 0.5 mm “volume” element of the material.
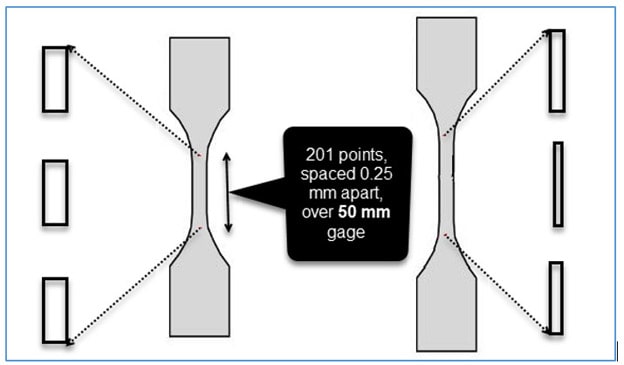
Fig. 4: Schematic of tensile specimen with additional virtual points along its centerline
By tracking each point independently, the strain can be measured, the stress computed, and an independent stress-strain curve developed for each individual point. But – why bother?
Here’s the basic assumption underlying the standard tensile test: both strains and stresses are expected to be uniform over the 50 mm gage length prior to load drop and the start of diffuse necking (see Figure 2). Based on this key assumption, we can expect that the stress-strain curve determined from each of the 201 points using the DIC method will be identical.
However, that is not how the results turned out: every single point monitored showed a different evolution / growth of strain, and these differences appeared well before UE; that is, well before what is considered the onset of diffuse necking, when strains are expected to begin diverging (see Figure 5 below).
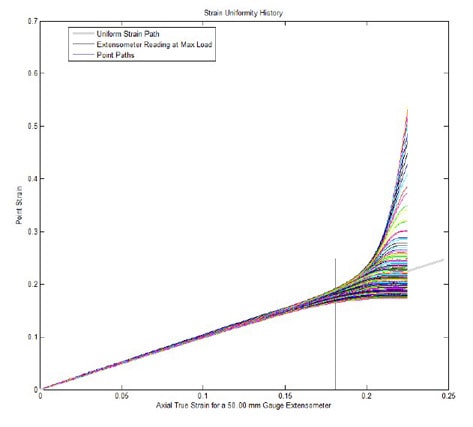
Fig. 5: Strain growth at the 201 points on the tensile specimen tracked using DIC
This reaffirms an old yet commonly ignored understanding – that strains and stresses are not uniform over the gage length of a tensile specimen.
Advanced mathematical techniques have been developed to explore DIC-generated data to identify and track the localized neck point, from prior to the onset of necking all the way to failure. Figure 6 below is an interesting chart that overlays the true stress-true strain curve for EACH of the 201 points.
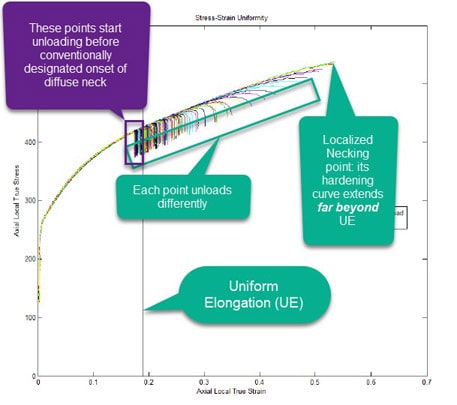
Fig. 6: Local true stress-strain curves for each of the 201 points
Some interesting observations:
- All the points follow a very similar stress-strain path to their respective unloading / failure.
- Points in the so-called “diffuse” neck continue to harden well past the uniform elongation measured from the standard 50 mm gage length of the specimen.
- The localized necking point shows the farthest evolution of the stress-strain curve.
So, by identifying and tracking the localized necking point, we can evidently generate hardening curves beyond UE. Therefore, we have a helpful method to establish a reliable constitutive model for a specific material based simply on a tensile test!
Let’s compare the stress-strain curves for a DP 1180 material i) obtained from the standard 50 mm gage length, and ii) from the localized necking point using DIC (Figure 7).
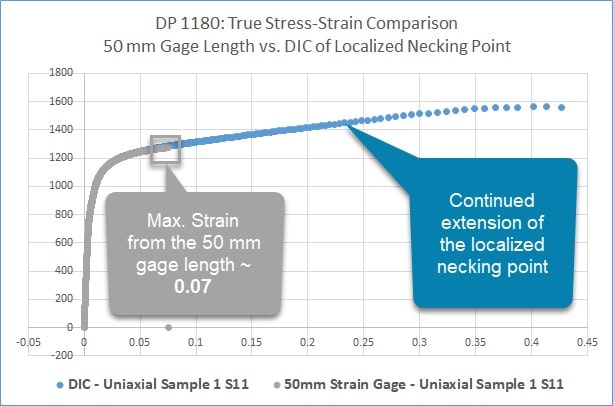
Fig. 7: DIC tracking of the localized necking point is clearly capable
of reliable extension of the hardening curve
Here are a few takeaways from these fascinating and exciting results:
- Contrary to widespread assumption, the gage area of a tensile specimen shows non-uniform strain distribution starting well before onset of diffuse necking; as a consequence, the hardening curve and other characteristic material parameters represent only a reasonable average of material hardening.
- Aggressive DIC techniques are shown to track strain distribution, and more importantly, the stress-strain progression at the point of localized necking all the way to failure – leading to higher strains and stresses on the material hardening curve.
- Seeing that the localized necking point shows viable strains of over 30% for the DP 1180 material (Figure 7) does NOT imply that this material is any more formable than we understand it to be. DIC is simply a means to extract deeper characterization of the inherent behavior of this material – it does not constitute proof of increased formability.
- DIC-based techniques for enhanced tensile characterization are still under development at NIST, corporate R&D divisions, and several universities around the world. While we don’t have a specific timeline, we look forward to their wider commercial adoption soon.


?")


