
Introduction
For years, CAE has enabled significant improvements and cost reduction in the process of parts forming. One such improvement is the combining of both the process optimization and robustness analysis. This allows you to simultaneously optimize the forming process and predict the real production on your computer. In the following example, this combined approach is used to analyze and vastly improve the tube forming process.
The Process
A tube formed part is created using the process shown in Figure 1, which involves bending, forming, hydroforming and trim operations. The process parameters are listed in Table 1 (column “Nominal”). The forming station is required to fit the initial tube into the downstream tool’s narrow cross-section. Using this setup, the results are well within the specified tolerances. The springback is negligible, the thinning is within spec, and there is no indication of wrinkling or buckling, as quantified in Table 2.
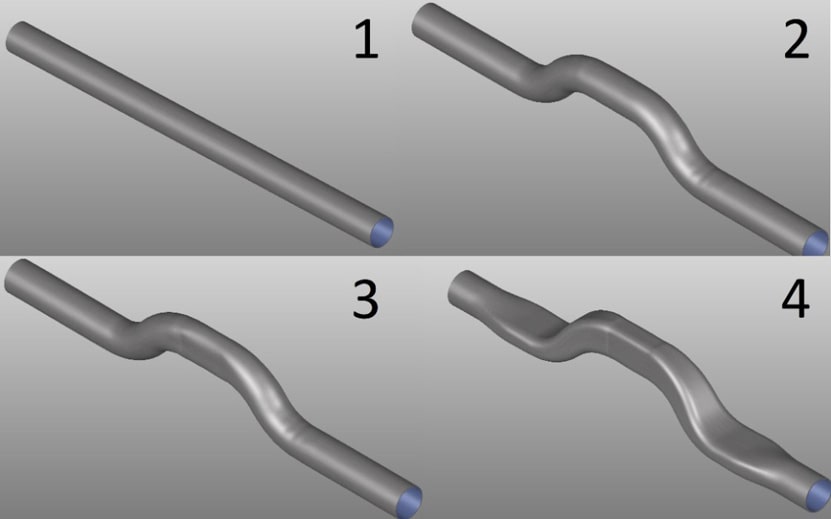
Figure 1 – Visualization of the complete tube forming process
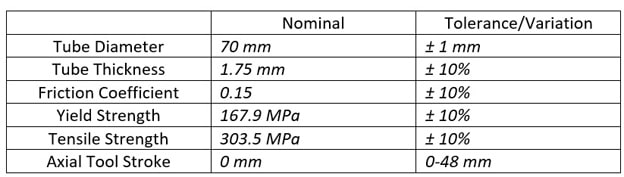 Table 1 – Process parameters
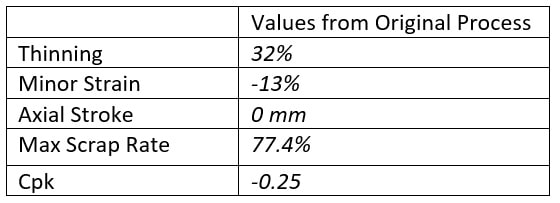
Table 2 – Original process results
The Problem
Since single simulations only represent single conditions in reality, it is mandatory to check different conditions while optimizing the process. For instance, the tube purchased from the supplier may be too thick, too weak, or have an incorrect diameter. If this were to happen while up against a tight deadline, it is up to the die designer to improvise accordingly. This workflow requires extensive background and experience. During the resultant troubleshooting, money is spent, time is lost, and profit margins continuously shrink.
The Solution
Using CAE capabilities to solve the aforementioned problem, robustness is analyzed during optimization to ensure a stable production process; this is known as Robust Systematic Process Improvement (RSPI). Through this operation, the dominant process variables and scrap rates are predicted. It is then up to the engineer to determine which is more cost effective: a process change or a large scrap rate.
As a first step, the known production process variations listed in Table 1 (column “Tolerance/Variation”) are input into CAE. This creates a series of possible outcomes for the simulation engineer to analyze.
The Results
Simulating the original process robustness yields low Process Capability Index (Cpk) values. Cpk is the statistical measure of a process’s capability of falling within defined specifications. In this process, the design specification utilized is “Thinning”. A Cpk color scale is shown in Figure 2.
![]()
Figure 2 – Thinning lower Cpk color coding
As seen in Figure 3, the process and simulation are not as successful as previously believed, when common production process variations are taken into account. As a general rule, a higher Cpk value indicates a more stable process. In the investigated case, Cpk values drop to a minimum of -0.26, which translates to a 78% scrap rate.
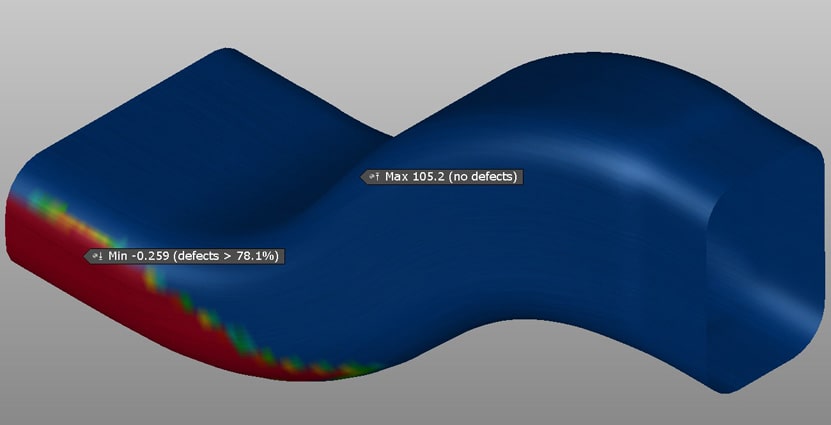
Figure 3 – Thinning lower Cpk of original process in AutoForm TubeXpert.
With such a high scrap rate, this process cannot see the light of day. For this reason, the designer adds a few process parameter variations to the simulation in a second step. The variations are listed in Table 1 (column “Tolerance/Variation”), including the addition of axial tools. These tools feed material into the cavity from either side of the tube. Based on these process variations, the robustness analysis predicts that axial stroke is the most influential parameter, as shown in Figure 4 below.
Analyzing the RSPI results further, a 2D plot of axial stroke vs. thinning indicates a best-fit line from the scatter of simulation results – this is shown in Figure 5. The best-fit line is used to determine the axial stroke required and provides a realistic number to incorporate into the process. In this case, axial stroke appears to lose its increasing influence on the tube thinning at around 50 mm, as indicated by a flattening of the curve.
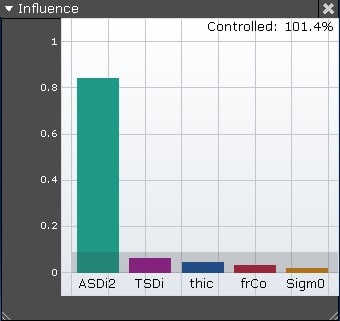
Figure 4 – Influence of input parameter variation in risk area
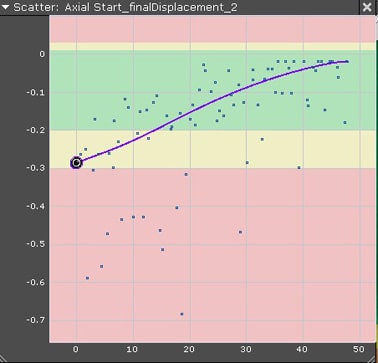
Figure 5 – Axial tool stroke influence vs. thinning, axial feed in mm (x-axis), thinning (y-axis)
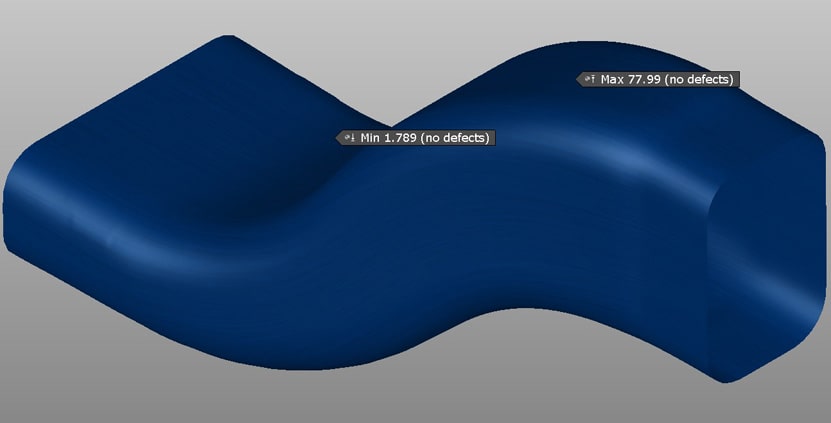
Figure 6 – Thinning Cpk of process with axial tools
The Cpk values have shot up together with the axial tool’s movement, reaching a value of 1.79 with effectively zero scrap. This represents a highly robust process, as shown in Figure 6. In-depth analysis of the results from Table 3 shows that thinning has also been greatly reduced, from 32% to 19%. Minor strain, an indicator of buckling/wrinkling, increases in magnitude from -13% to -24%. This will not necessarily lead to buckling, but it does increase the risk of occurrence.
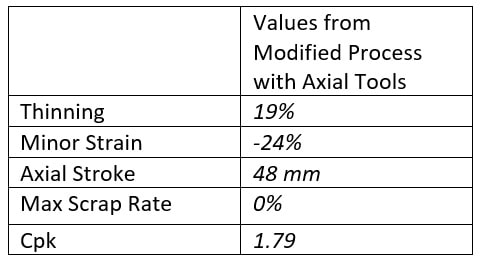
Table 3 – Optimized process results
Conclusion
Using CAE capabilities to simultaneously optimize the tube forming process and analyze robustness, the scrap rate is improved significantly from the original process without axial tools. One particular area decreases from 77.4% to 0% scrap rate. As such, the process no longer hangs on the brink of failure. It is intelligently designed considering typical production process variations, while maintaining the ability to generate a part within tolerance. The RSPI is the most effective approach to ensure an ideally optimized process that is simultaneously robust. By adopting this method, you can eliminate trouble during production and save both time and money while at the same time increasing the part and production quality.


?")


