
Drawbead Reduction Strategy Put to the Test on B-Pillar Trial
In this blog post we cover a method that can be utilized for systematic drawbead design while ensuring the lowest number of engineering loops possible. The workflow for getting more insights about the process definition is described using a real automotive part in practice.
One of the essential steps in the engineering of the drawing operation in sheet metal forming is the design of drawbeads. The position of drawbeads and their profiles must be optimized carefully to get a reliable process that leads to production of high quality parts with minimum material usage. But a common practice in the automotive industry is to use manual optimization to arrive to a successful design. In this approach, successive simulations are run to find the best concept of the drawbead layout and to get the optimum restraining. Multiple simulations are then evaluated manually based on some quality criteria. The main disadvantage of this iterative trial and error approach is the lack of transparency in the decision making and the limited information concerning the potential process window.
Alternatively the Systematic Process Improvement methodology can be used to address and solve critical issues in the stamping processes.
Using an automotive panel it will be shown that the proposed approach offers more transparency over the drawbead design and provides essential information about fine tuning of the forming process during try-out and production phases.
It Starts with an Efficient Drawbead Model
Seeing the modeling of drawbeads in forming simulations using real CAD geometries demand high CPU times, a better and more efficient solution is to use an advanced adaptive line bead model. Unlike other line bead models, drawbead restraining and uplifting effects are updated continuously during the simulation, already lending its advantages.
The Drawbead Reduction Strategy in Design and Try-out
In most of the cases, drawbead segments require modifications. At the conceptual development phase, an engineer might vary the drawbead outlines, number of drawbeads and test different profile geometries. Type and the definition of the profile shape are typically described in a company standard, but still the engineer is relatively free to choose suitable drawbead geometry. As shown below, both bead and groove can be adapted to come up with the profile that gives the optimal restraining. Generally the clearance between the bead and the groove is fixed.
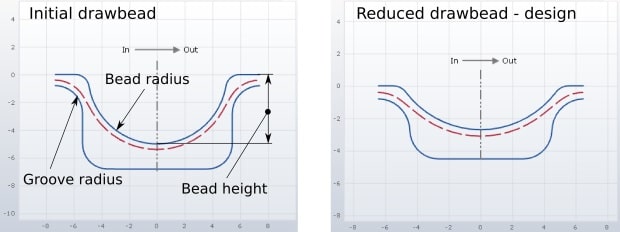
Fig. 1 Reduction strategy – design. Clearance did not change despite the different restraining force.
During real tool tryout the drawbead might be reduced to achieve optimal forming conditions and a successful forming process. In this case, tool geometry has already been machined and the typical approach is to take away some material from the drawbead geometry to reduce its restraining effect. Strategies to carry out such reductions are also described in company standards and generally only permit the removal of material. For example, first groove radii are increased to get the desired effects. If this is not enough, bead height can be reduced next. Usually, groove width remains unchanged.
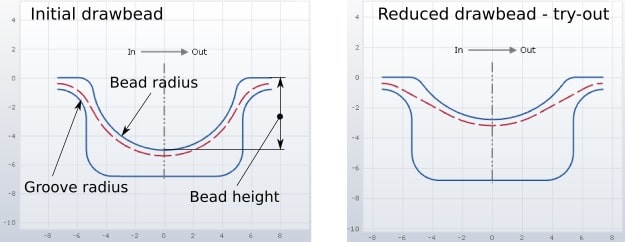
Fig. 2 Reduction strategy for tryout. Here, the clearance increased (radii are the same, bead height is different and clearance is different)
In engineering, control over drawbead modification is introduced through a single parameter defining the reduction state. Starting point is the initial drawbead profile that typically represents the strongest restraining force. Reduction state can assume values between 0 (fully reduced state, lowest restraining force) and 1 (initial state). The current drawbead profile is determined by the value of the reduction state and the corresponding parameters defined in the reduction strategy.
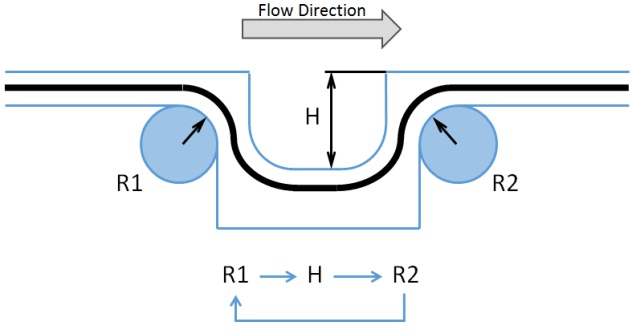
Fig. 3 Example of reduction strategy. This strategy prescribes that first the groove entrance radius (R1) is increased, then if necessary bead height (H) is reduced and after that, if the drawbead is still too strong, groove exit radius (R2) is increased.
Application Example
For the real part example, a B-Pillar reinforcement was used.
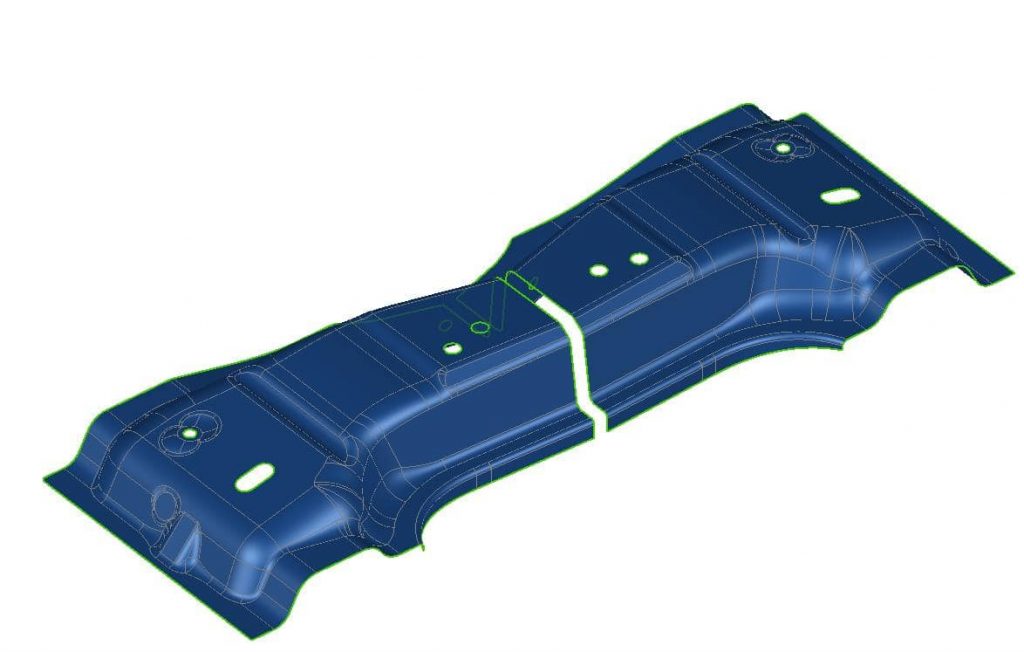
Fig. 4 Test B-Pillar from HC180B, thickness of 0.8 mm and double-attached part production.
For this part a complete simulation setup was defined and calculated. Figure 5 displays the contour plot of the result variable Formability, which gives a quick overview over forming issues. The results show no split issues, but the part is not sufficiently stretched and there are thickening areas that might lead to part wrinkling. So far no drawbead is specified.
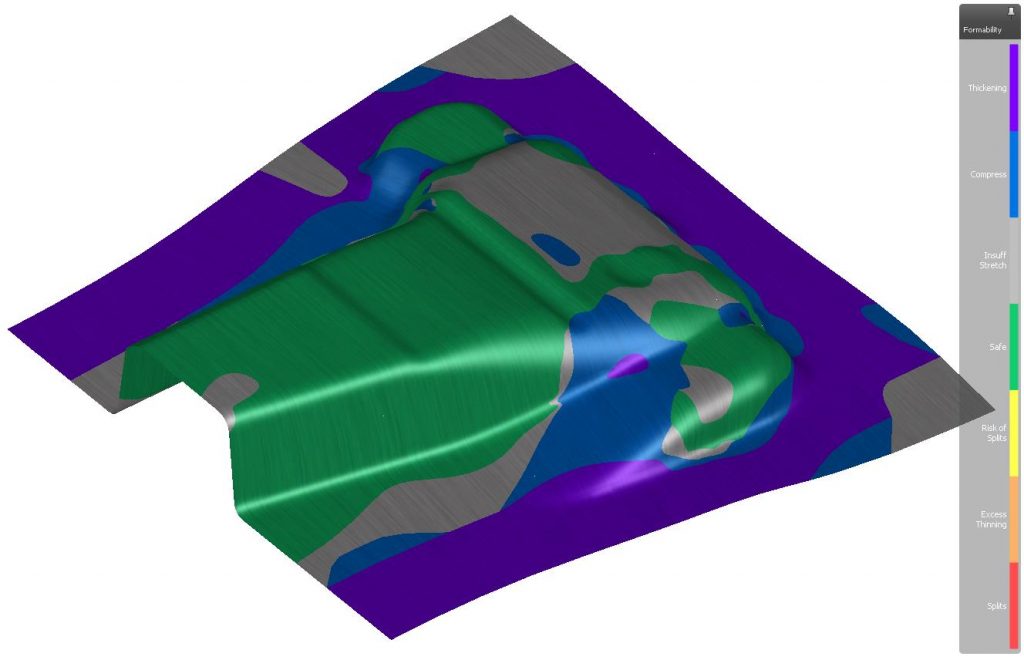
Fig. 5 Formability results of the base simulation without drawbeads.
To improve the current result, the next step in process design is to define a drawbead to introduce greater stretching into the part without creating splits. Now one of the typical tasks of a simulation engineer is to identify an efficient segmentation of such drawbeads. In combination with the already described function of a reduction strategy – the Systematic Process Improvement approach will be used.
The reduction strategy is defined as follows:
- Change bead height from 5 to 1mm.
- Change groove radius from 2 to 4mm.
In case of reduction state 1: Bead height = 5mm; Groove radius = 2mm
In case of reduction state 0: Bead height = 1mm; Groove radius = 4mm
Reduction state is defined as a design variable and 8 simulations – here called realizations – are calculated. Using a meta-model constructed from these multiple simulations the simulation engineer is able to investigate the influence of the reduction state on any critical zone, e.g. by means of the scatter plot shown in Figure 6. The Y-axis of this plot represents the Max Failure variable – the result variable that estimates presence of material splits. The background colors represent the required limits, i.e. the red color zone must be avoided since the material will split, yellow is close to the critical limit and the material can show some necking, green is the safe area. Depending on the value of the reduction state, the expected result in a critical area will be shown by the purple circle on the meta-model, represented by the purple curve.
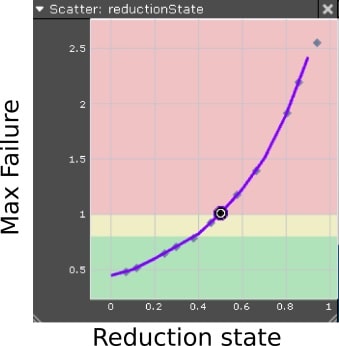
Fig. 6 Scatter plot showing correlation between reduction state and result variable Max Failure in the selected element of the sheet.
Such information allows the process engineer to choose suitable bead profiles to obtain optimum control of the material flow. This results in an efficient segmentation of the drawbead around the part. For example, as shown in Figure 6, the current reduction state of 0.5 would not lead to a safe part because it is located between red and yellow area; reduction state should be lower than 0,4 because only in those cases the “working point” would lay in the green colored area. In further areas other reduction state values are required. In summary, the preferable local reduction states lead to the final drawbead segmentations.
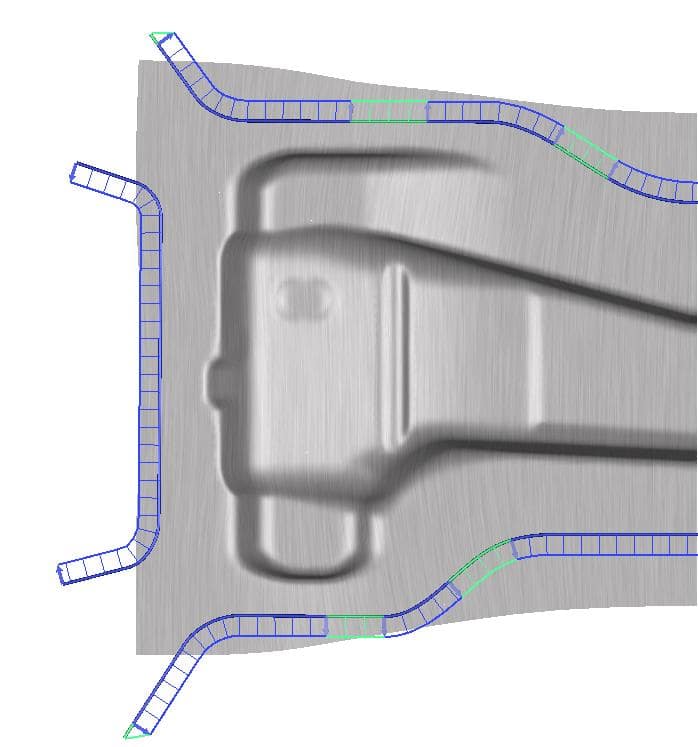
Fig. 7 Identified segmentation of the drawbead.
Figure 7 shows that in this case, seven segments around the part would be necessary to get a successful and stable process. Six of these segments are connected by some transition zones visualized in light green color.
Verification of Identified Drawbead Segmentation
After this segmentation, verification analysis should be performed by using the same reduction strategy applied to each segment. Systematic Process Improvement analysis with seven design variables is done. Results of these multiple simulations are then evaluated in a semi-automatic way. Several result variables that characterize quality and performance of the part are chosen and their required limits are defined. In this case, limits for splits and wrinkles are specified. For example, the split limit is defined if Max Failure value exceeds 0.8 (strain state is 20% below the forming limit curve) and thinning is larger than 25%. Based on the defined limits for issues, critical and potentially critical zones are found automatically in an issue-check. Each of these zones is interactively checked to determine whether the found issues must be taken into consideration in further evaluation. After that, the accepted issues can be used to get an automatic proposal of a possible solution that fulfils all required limits altogether.
The results for the proposed reduction state settings are shown in Figure 8, based on the result variable formability. As can be seen, the stretching of the part is clearly improved and any split issues are avoided.
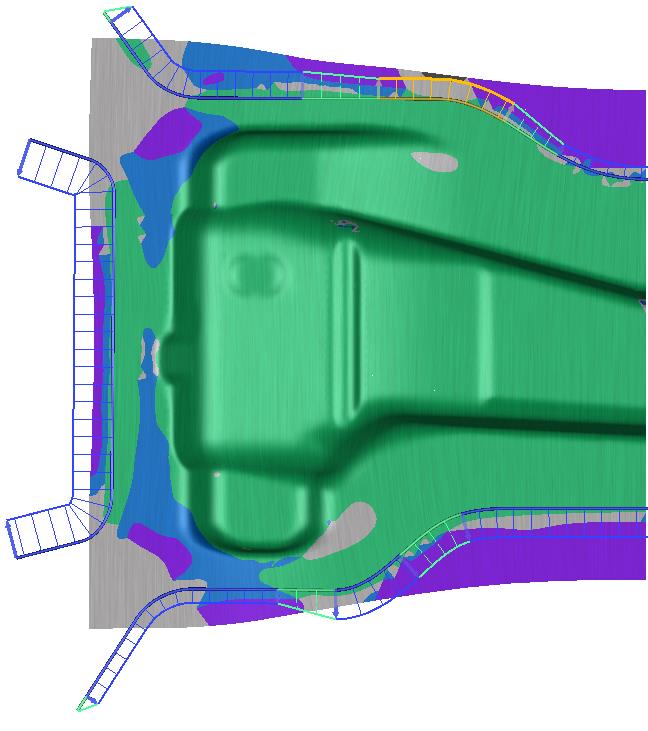
Fig. 8 Formability plot for the best values of reduction state for each segment.
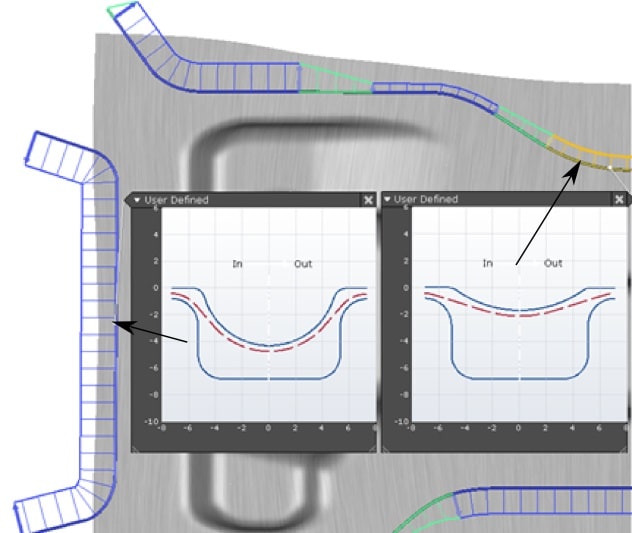
Fig. 9 Relation reduction state to the drawbead profile.
Finally, each value of the reduction state corresponds to a real drawbead shape. Figure 9 shows drawbead profiles at two different segments, i.e. the left drawbead with higher restraining compared to the right one.
As it can be done in the concept and design stages described above, the SPI approach can be expanded taking into account many other process relevant uncertainties in form of noise variables. Among others, a typical use case is the application of tolerances in material properties. So the cascading process of design-related and noise-related reduction strategies for the drawbead segments ensures reliable safe production results when the tools act in the press line.
“The proposed method can be considered as a reliable approach to obtain optimal design of drawbeads in a stamping tool. It consists of several well-defined steps that can be easily performed by a process engineer during the development of the drawing operation. The method keeps the number of engineering loops at a minimum and provides more insights about the process window and possible process control during try-out and production.” Igor Burchitz, Technical Product Manager, AutoForm
Thank you to our three AutoForm authors: Igor, Bart and Michael! For our new readers, don’t forget to subscribe to our blog! We’ll send you just one email per month featuring our top posts and zero marketing emails!


?")


