
Introduction
When it comes to quality, it is normal to think about the final result of the production process, that is, characteristics related to the product. In modern production systems, however, the concept of quality, from a broader point of view, is related to the achievement of maximum productivity, the reduction of production costs and, finally, the quality of the final product. In the manufacture of stamped products it can be easily verified that the three factors mentioned above affect each other. In fact, a non-robust production process results in frequent press interruptions, lower efficiency in stamping (parts/press hub), high number of rejected parts, generating more scrap. Longer downtimes lead to increased production costs. Therefore, it is vital to ensure the robustness of the process in sheet forming. In this context, it is extremely important that the most significant influence parameters for the result of the manufacturing processes are known already in the initial stages of the product development stages.
The increasing use of high strength materials brings with it additional challenges compared to conventional low to medium materials, such as higher tooling and maintenance costs. Due to the greater difficulty of forming high-strength materials compared to conventional materials, providing greater robustness at all stages of the manufacturing process is essential to ensure the overall quality of the process.
Today, more than ever, in planning the manufacture of stamped components, the choice of material to be processed has significant consequences on the process technologies that will be used to manufacture it, and consequently on the costs involved. The type of material to be formed influences all the links in the production chain, such as defining the manufacturing and forming stages, designing and manufacturing tools and choosing technologies for joining and assembling subassemblies.
The importance of material characterization in stamping processes
The characterization of sheet properties is usually associated merely with their behavior during forming, but their influence is much broader, as illustrated in Figure 1.
In the early stages of development, its role is mainly related to the toughness and strength characteristics of the final product. In parallel, geometric specifications related to component design need to be considered. In the first case the properties after fabrication are relevant, while in the second the focus is on the formability limits of the materials used.
The Methods Plan defines the specific sequence of steps in a production process. It deals with the shape (geometry) and material (properties) of the product, on the one hand, and the tools and machines, on the other. At this stage it is determined which processes the product must be manufactured. In this step, reference surfaces for the various forming stages are created and time and movement estimates are made in all operations. This phase is crucial for building a robust manufacturing process. Changing or correcting a deficient methods plan is usually associated with unanticipated investments, increased raw material and tooling costs, frequent press stoppages and other undesired consequences.
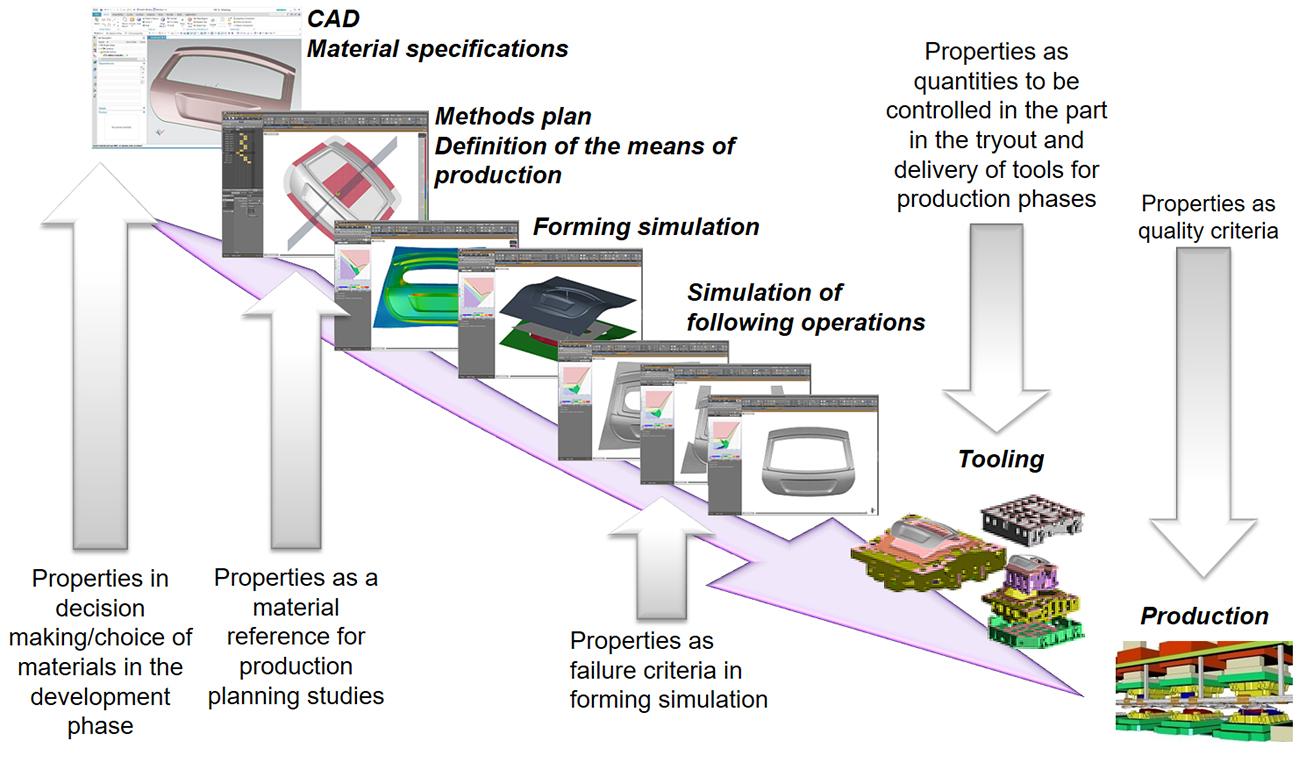
Figure 1: Different functions of the mechanical properties of sheet materials during the development stages of a stamped component. Adapted from [1].
In the simulation steps, the correct characterization of the material’s formability is an essential element, especially for obtaining reliable results in critical regions such as hemmings, hole expansion, springback, and surface defects (Figure 2). The failure criteria used depend on the type of modeling of the process being simulated, as well as the choice of formability assessment tools available.
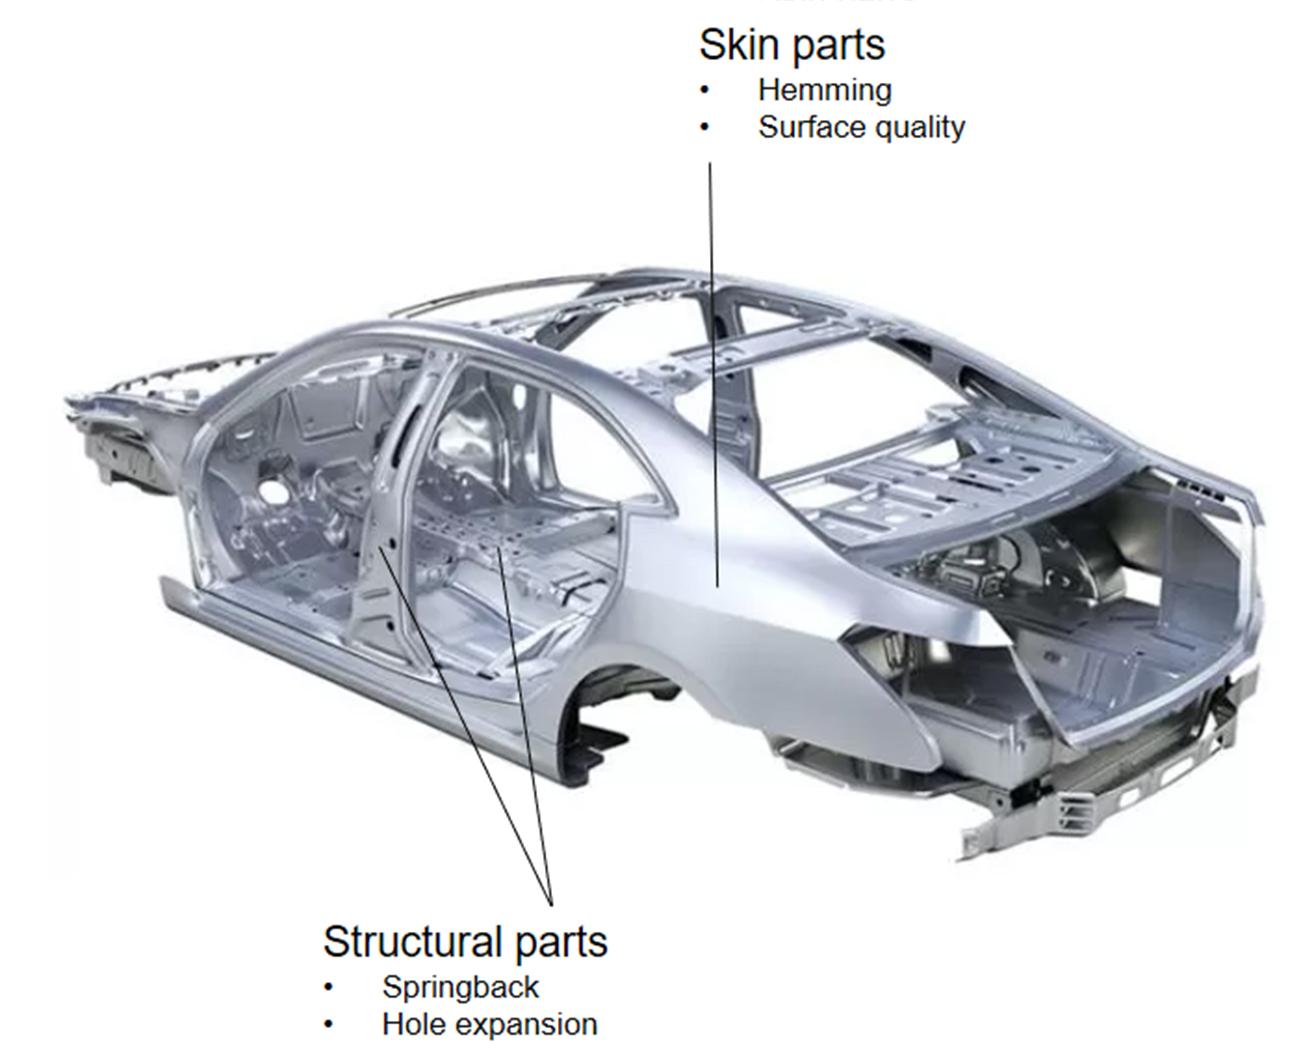
Figure 2: Most critical elements in simulating the formability of stamped components, where the correct characterization of the material has doubled importance.
After the tool construction and assembly phase, it is in the tryout phase that the material properties come back into focus. The success of measurements and corrections performed in the tryout depend on knowledge and control of the variability of material properties, so that the delivery to production is successful.
Finally, in production, material properties are included in the control and monitoring plans of the factory’s quality system and continue to be used as important reference elements for the investigation and resolution of manufacturing problems.
Methods for characterization of stamping materials
Regarding the characterization of sheet formability, several methodologies have been developed, mainly over the last 50 years. These allow to determine the elasto-plastic properties and failure modes in uniaxial and/or multiaxial strain states. The conventional tensile test is the most widespread method, however, when you want to represent specific stress/strain states in a controlled way, other types of tests can be used. Regardless of the methods for obtaining the properties, the objective is only one: to create a mathematical model that correctly reproduces the flow start moment and subsequently the evolution of the flow curve with the deformation, in the different stress/strain conditions that occur during the conformation.
Models aiming a better characterization of materials gained a strong boost with the evolution of numerical simulation techniques. In the simulation, the model created for the material is used in the pre-processing step, being an essential input for obtaining reliable results. In addition, it is also used later in the post-processing step of the results obtained, mainly in the criticality assessment of the different regions of the part, as shown in Figure 3.
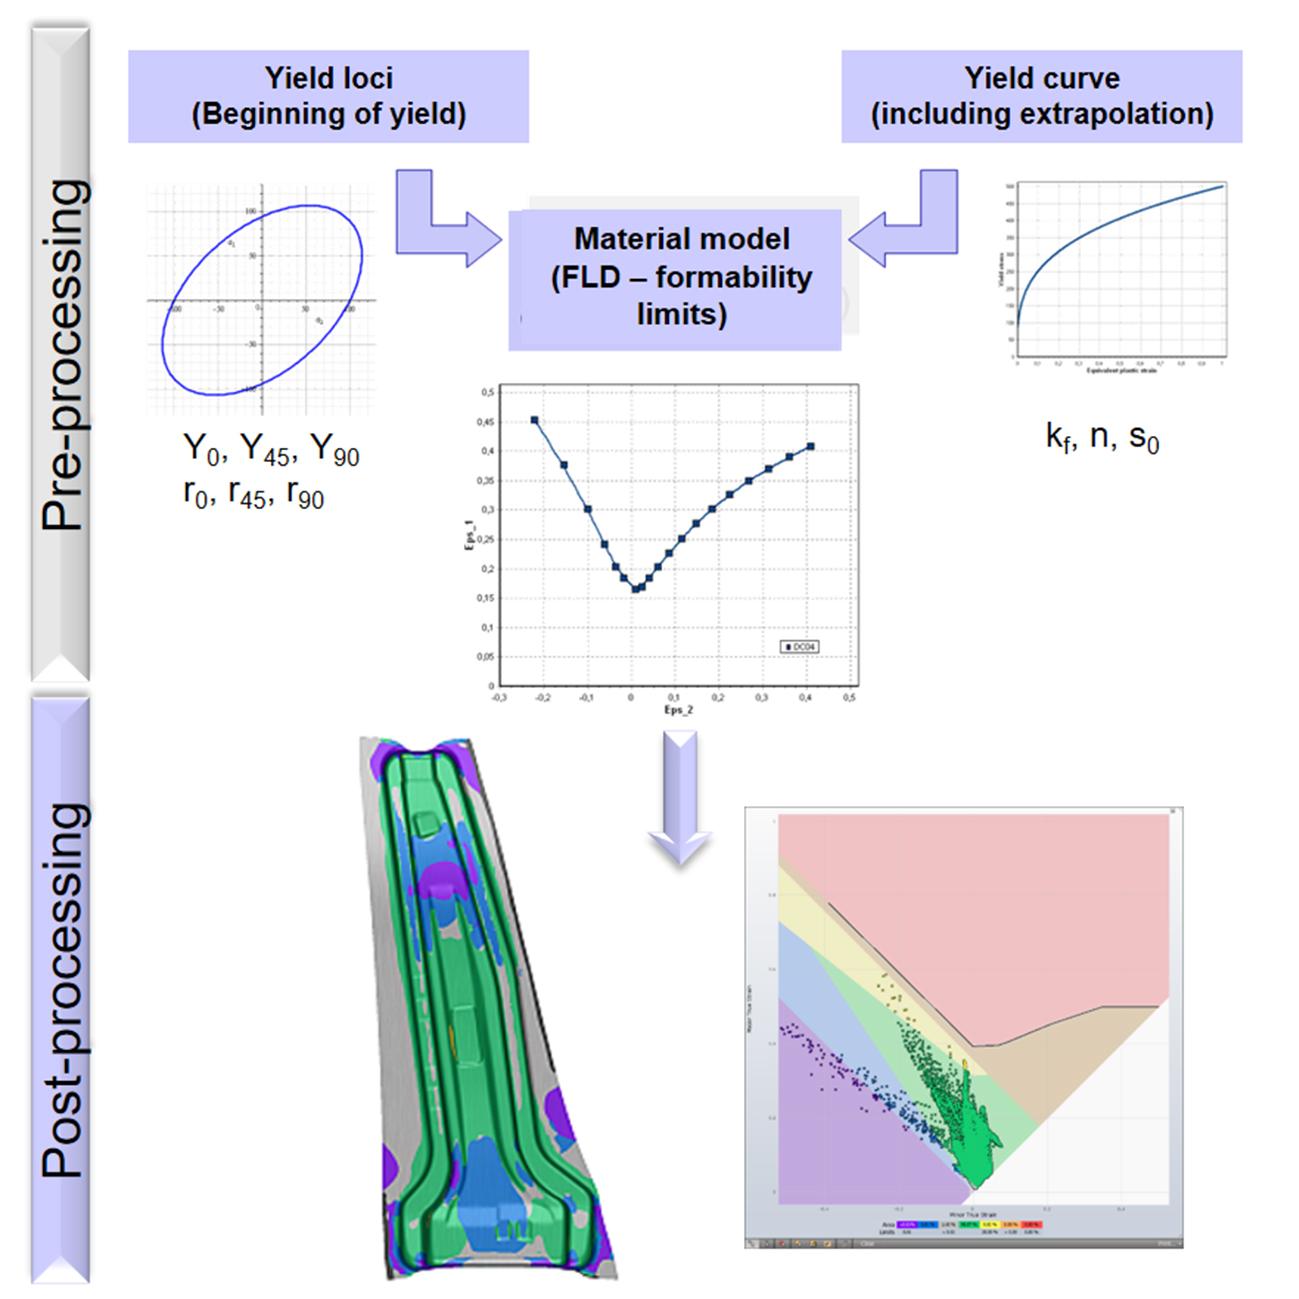
Figure 3: Use of material models to evaluate the conformability of stampings. Adapted from [1].
Characterization of sheet formability limits
The characterization of the maximum formability limits is of central importance not only for the numerical simulation of the forming process, but also, as mentioned above, for guaranteeing the safety and success of the actual process in modern stampings. The Forming Limit Diagram (FLD) represents the formability limits as a consequence of constriction and instability in a plane deformation space, as shown in Figure 4.
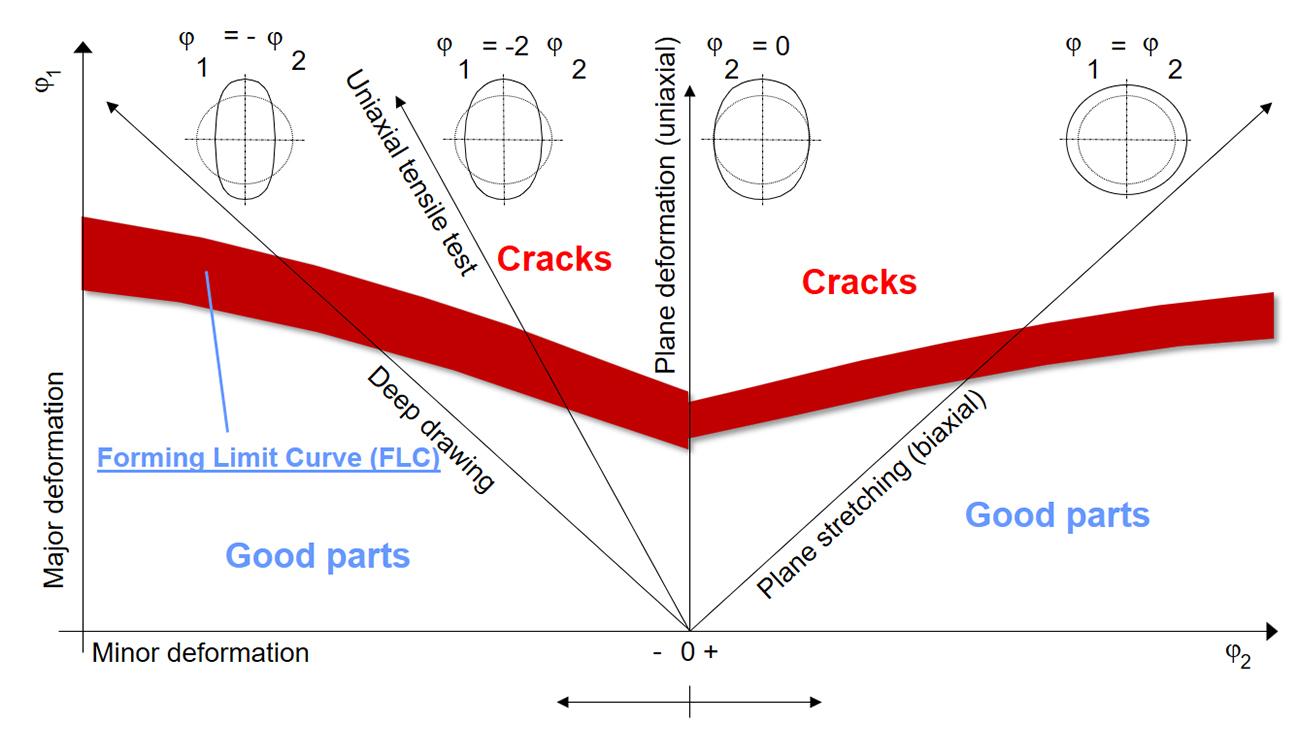
Figure 4: Representation of the strain plane and the limit curve. FLD is the main tool used in the evaluation of the conformability of stamped parts, both in the simulation steps and in the evaluation of the finished part quality. Source: [1].
The right region of the deformation plane represents situations where the sheet is being subjected to tension in both directions of the plane (ϕ1 and ϕ2 positive). The left region describes cases where one of the deformations is compressive (ϕ1 positive and ϕ2 negative). The FLD is one of the most important visualization tools for the development of stamping processes, as it allows to visualize how far the different regions of the part are in relation to the material’s formability limits (red band in Figure 4). The technique for determining the CLC is normalized by the standards:
- ISO12004-1 [2].
- ISO12004-2 [3].
It is important to emphasize that FLD only considers linear deformation paths. In the case of non-linear deformation paths the curve limits can be significantly changed.
In addition to ISO12004, other practical tests have been developed over time in an attempt to represent different positions in the FLD deformation plane, and can be used for the characterization of sheet formability limits. The best known are listed below:
- Standard tensile test.
- Tensile test with lateral restriction
- Tensile-compression test
- Stacked compression test
- Shear test
- Tensile test with Yoshida coupon
- Nakajima test (ISO12004)
- Marciniak test (ISO12004)
- Tensile test in cross-shaped coupon
- Bending test
In the chapters that follow the tests mentioned above are explained in more detail, as well as what each of them can tell us about the formability of the sheets.
Standard tensile test
The determination of mechanical properties through the standard tensile test according to ISO 6892-1 [4] is the most used way to characterize the formability of sheets, due to its ease and low cost of realization. The properties are used as a basis for simulation, component design, and quality assessment of sheet supply for production.
The properties that are normally obtained through the tensile test are (see Figure 5a):
- Yield stress σe0,2
- Ultimate strength (tensile strength) Rm
- Strength at break σBr
- Uniform elongation
- Necking elongation
- Elongation at break
- Hardening coeficiente
- Anisotropy
- Elasticity (Young) Modulus
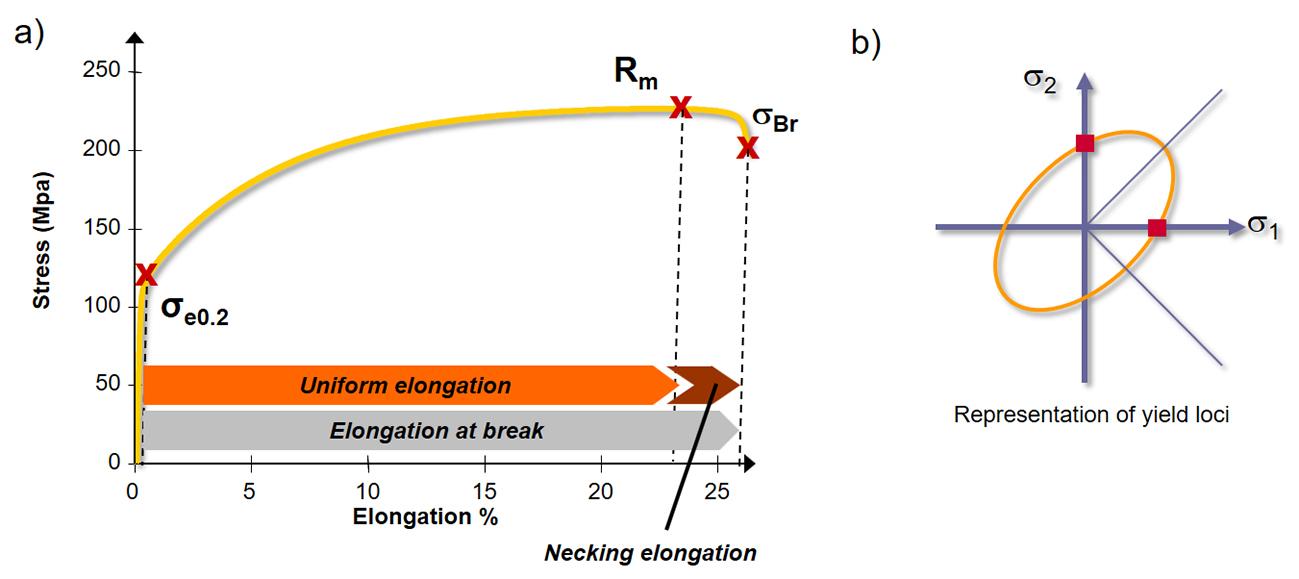
Figure 5: a) Tensile test curve and its main points. b) Locations in the flow envelope that are represented by the tensile test. Source: [1].
Figure 5b shows the points corresponding to the tensile test in a stress plane, where points on the σ1 and σ2 axes represent uniaxial stress states.
The geometry of the test curve provides a diversity of information and allows for comparisons between different materials. For example, materials with a higher strength threshold (Figure 6a) usually are more difficult to form, as yield stress and strength limit are higher (more strength is needed), and other parameters are also changed accordingly. However, the formability itself is usually not affected. As already mentioned, the pressing forces will be greater. Very important is the springback that increases along with the resistance. Ductility generally drops, as higher levels of strength are associated with greater sensitivity to cracks in edge regions. Regarding the performance of the final product, higher strength materials have greater potential for reducing the weight of vehicle structures, which is why their use is growing in the mobility industry.
The increase in uniform elongation represents greater formability (Figure 6b) and/or that the material has a greater elongation reserve, which represents an enlarged process window compared to a material with lower elongation. The forming process becomes safer. It is important to point out here that the value of the elongation after the start of necking should not be taken into account, as the appearance of thinning in the piece already means that the quality is compromised.
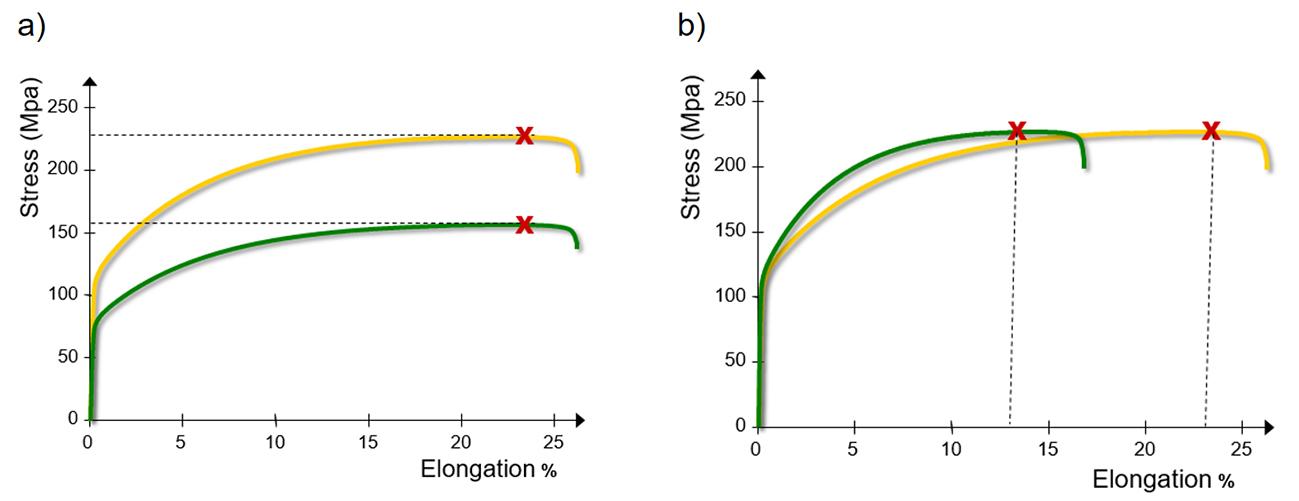
Figure 6: a) Materials with equal elongations and different strengths. b) Materials with equal strengths and different elongations. Source: [1].
The work hardening capacity of the material, that is, the increase in mechanical strength that occurs as a result of plastic deformation, is represented by the slope of the yield curve in the tensile test, as shown in Figure 7a. The work hardening index exerts a significant effect on the sheet formability, allowing for better forming results, especially on parts where the dominant mode of deformation is stretching. It is important to mention that although a unique n value is associated for each material, it actually varies with elongation, as shown in the example in Figure 7b. Therefore, it is important, when comparing materials, to make sure that the standard used is exactly the same.
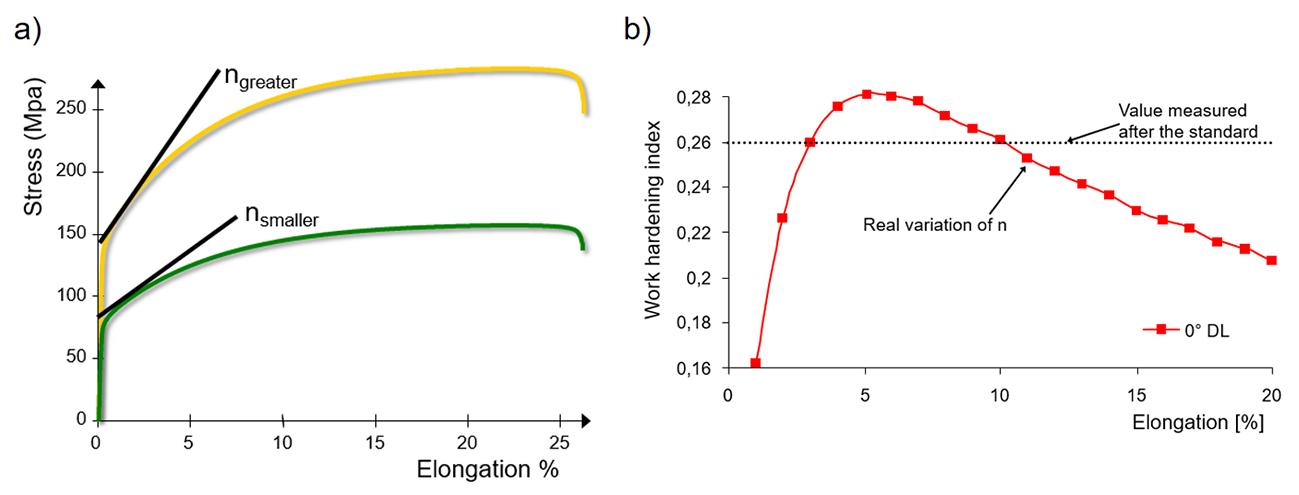
Figure 7: a) Two materials with different work hardening rates. b) real variation of n with elongation. Source: [1].
Indicators of the work hardening capacity of the material are the work hardening index n and the difference between yield stress and strength limit (ratio σe0,2/Rm). A high n results in greater migration of the deformation front through the part geometry, in addition to a more homogeneous distribution of deformations (see Figure 8). Also the tendency to necking formation is reduced.
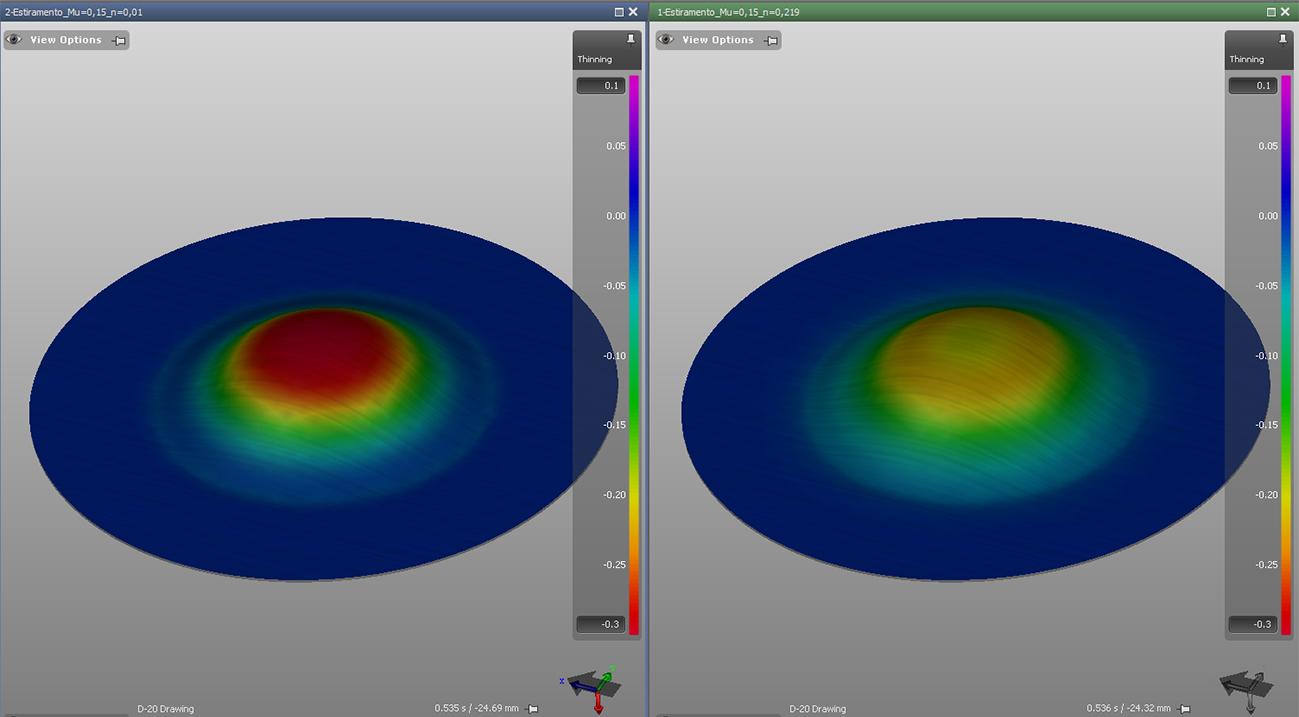
Figure 8: Simulation model showing a region in pure stretch, on the left with n=0.01 and on the right n=0.219. The colors represent the thinning suffered on the plate. Source: the author.
The anisotropy of the plastic behavior of a material, that is, its dependence on the direction in which the test is carried out, is measured through the normal anisotropy, which is represented by the letter r. In the tensile test, r can be calculated as the ratio between deformation in the width and deformation in the thickness of the specimen (Figure 9a). That is, normal anisotropy is an indicator of a sheet’s tendency to lose or reduce its thickness during deformation. It is desirable that the value of r be greater than 1. In practice, this means that the material tends to flow from the width and not from the thickness, that is, it has a lesser tendency to reduce thickness, improving its formability.
Another important parameter is the planar anisotropy, represented by Δr. It quantifies the variation of r in the plane of the plate (see Figure 9b). It is desired that Δr be as close to zero as possible, otherwise there is a greater tendency to so-called earing (plate flows more into the tool in certain directions). Furthermore, the overall properties of the sheet will have greater differences in relation to the rolling direction, which is detrimental to the process (Figure 9c).
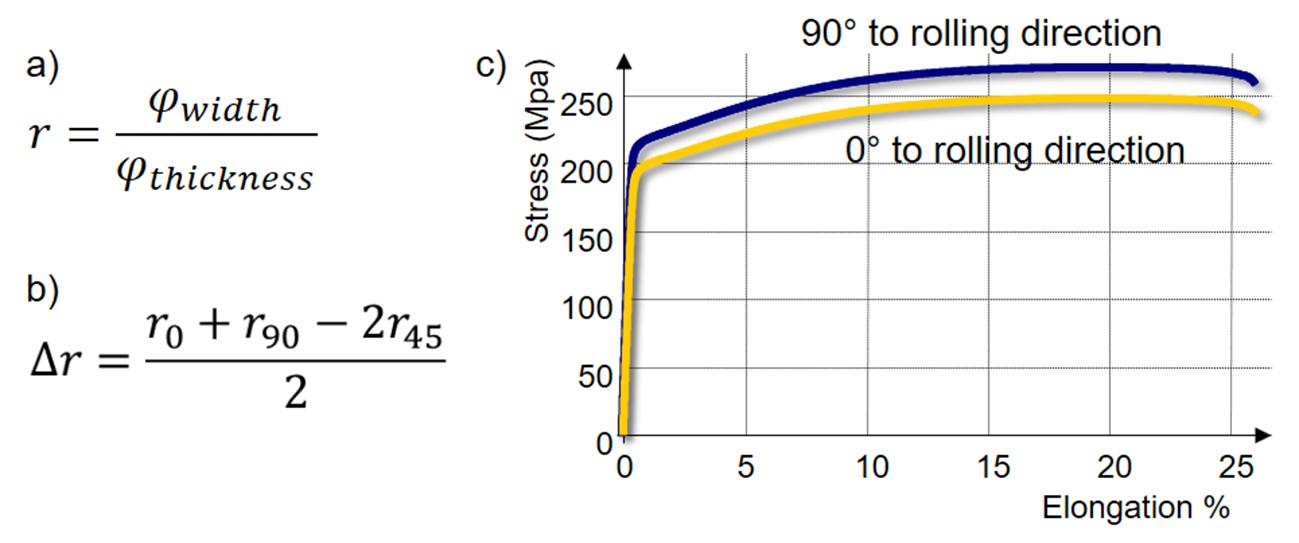
Figure 9: a) Definition of normal anisotropy, b) definition of planar anisotropy and c) differences in sheet properties when measured in different directions. Source: [1].
In the next chapter of the article, the other tests listed above will be addressed, as well as aspects related to the variability of properties and their influence on the simulation results.

Dr.-Ing. João Henrique Corrêa de Souza worked as researcher from 2003 to 2008, earning a PhD degree at the Institute of Metal forming Technologies, Stuttgart University. In the industry, worked as a researcher, R&D Manager and Senior Engineering and Tool-shop Manager, from 2008 to 2020. Since 2020 is Visiting Professor at the Federal University of Rio Grande, Brazil. At the same time is the National secretary of the BrDDRG – Brazilian Deep Drawing Research Group and coordinator of annual the BrDDRG Sheet Metal Forming Congress and Owner and director of TechnNOVA Pesquisa Desenvolvimento e Inovação Ltda, as representative of Autoform Technologies in South Brazil and offering consulting/ training services in sheet metal forming and R&D.
https://www.linkedin.com/in/joaohcdesouzametalforming
References
[1] Liewald M. Vorlesungsskript Werkstoffkundliche Grundlagen der Blechumformung. 2009, Institut für Umformtechnik, Universität Stuttgart.


?")


