
Why Relying on a Single Incremental Simulation is Not Ideal
A major Tier 1 parts supplier, referred to hereafter as the “customer”, once relied on single increment forming simulation results to advance their engineering designs to tryout. In this article, we report on how this customer utilized robustness analysis to identify the root cause of forming defects found in mass production after their initial simulation studies gave the go-ahead for part design.
The Forming Defects Found in Mass Production
During mass production, the forming defect was found on a mild steel dash panel. The part had already been examined using the AutoForm simulation, and all the forming defects were corrected before the tool was made. No defects were found in the subsequent tryout either.
However, once mass production began, wrinkles were found sporadically on the tunnel-shaped area on the center of the panel, causing production to be suspended.
It was already clear from the early engineering phase that splits and wrinkles could be expected to occur with this geometry. For that reason, a design concept was created to eliminate splits, and beads were added to suppress wrinkles. Then AutoForm was used to examine the optimal design with no splits or wrinkles. The feedback including a set of optimal process conditions was then incorporated into the part design.
Even so, the appearance of wrinkles led to the conclusion that the mass production was not stable. It’s important to note that the wrinkles were found only in the mass production — not in the simulation results or tryout, and no significant differences were found between the two results. Initially, it was suspected the process conditions were different between the mass production and the tryout. To verify this was the reason for the wrinkles in mass production, the customer used AutoForm to run a robustness analysis.
The Robustness Analysis
Table 1 shows the process parameters that can vary during mass production. The robustness analysis take into consideration these variations so that we can detect whether they cause wrinkles or not.
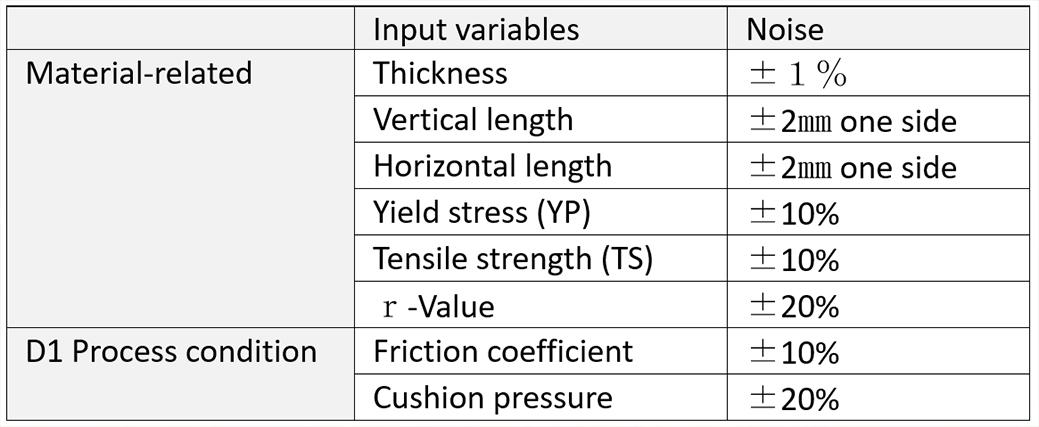
Table 1. List of variable process conditions
The robustness analysis automatically integrates the variable conditions (or “noise variables”), including max/min values and standard deviation, with multiple simulation models. These models are used to run multiple forming simulations in parallel, and the results are then summarized for post-processing.
Fig. 1 shows the Sigma analysis result. The circle shows where the wrinkles were found, indicating that this area is sensitive to the variance in process conditions (shown in red). The subsequent study revealed that the variance in the frictional process condition had the largest influence.
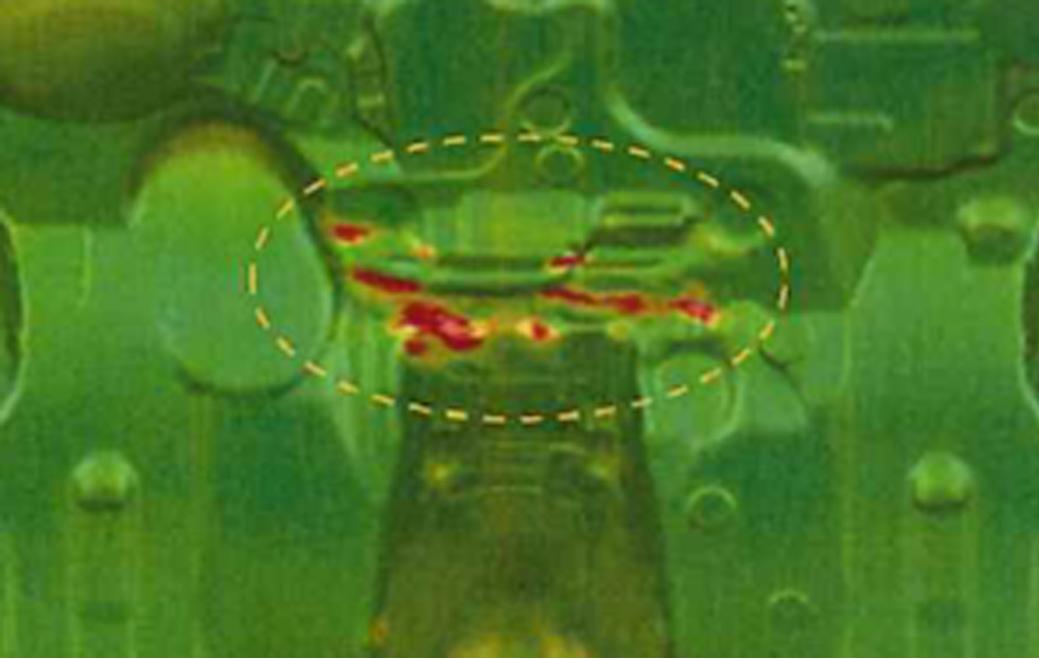
Fig. 1: Shows the stability (Cp – Repeatability) of the process in terms of formability considering the variability of the above-mentioned parameters. The red spots indicate where, within the part, the process is not stable and result variable goes outside accepted tolerance.
The variance in friction is caused by the amount of lubricant applied, but it is not easy to control fluctuations. Instead, the countermeasure applied was to make the wrinkles less sensitive to the variance in friction.
The Countermeasure on Wrinkles
The height of the existing beads was changed and the wrinkles were assessed. However, this intervention worsened the overlap of wrinkles, as shown in Fig. 2 (left). Since it did not appear possible to suppress the wrinkles by simply modifying the existing beads, more beads of optimal shape and positioning were added to the area of concern. As a result, no wrinkle overlap was found, as shown in Fig. 2 (right). Another robustness analysis was then conducted, incorporating the same variable process conditions and the additional beads.
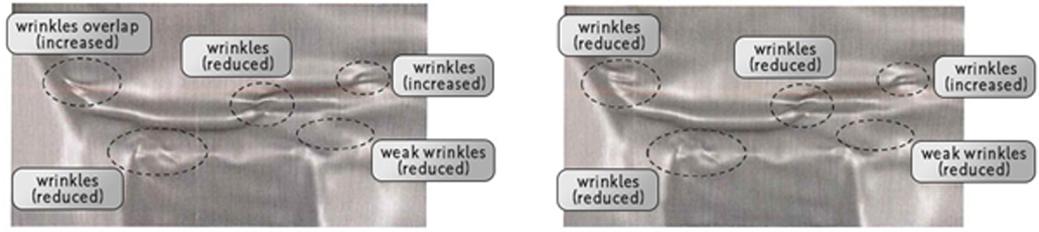
Figure 2. The beads to suppress wrinkles (Left: Modified height;
Right: Modified height + Additional beads)
The Final Robustness Analysis
With the countermeasure as above, the customer again ran a robustness analysis to examine the sensitivity of splits and wrinkles to the variance in process conditions. As shown in Fig. 3, the number of wrinkles was reduced after the modification. In addition, the quality was sufficient and the process was stable. Fig. 4 shows a forming limit diagram indicating the process is stable and the risk of splits is lower than threshold.
Prior to the actual production, it’s important to run the robustness analysis to determine whether the formability and springback are sensitive to the varying process conditions. Through this method, the sporadic defects during mass production can be predicted. If any defects are found during the robustness analysis, the geometry, process and process conditions may be modified to improve the robustness and prevent defects during mass production.
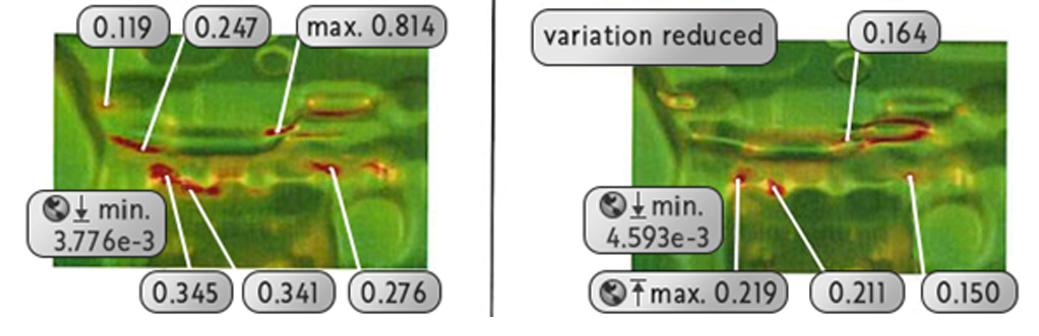
Fig. 3: The AutoForm analysis to assess variation of thinning in the process conditions (Left: before modification; Right: after modification)
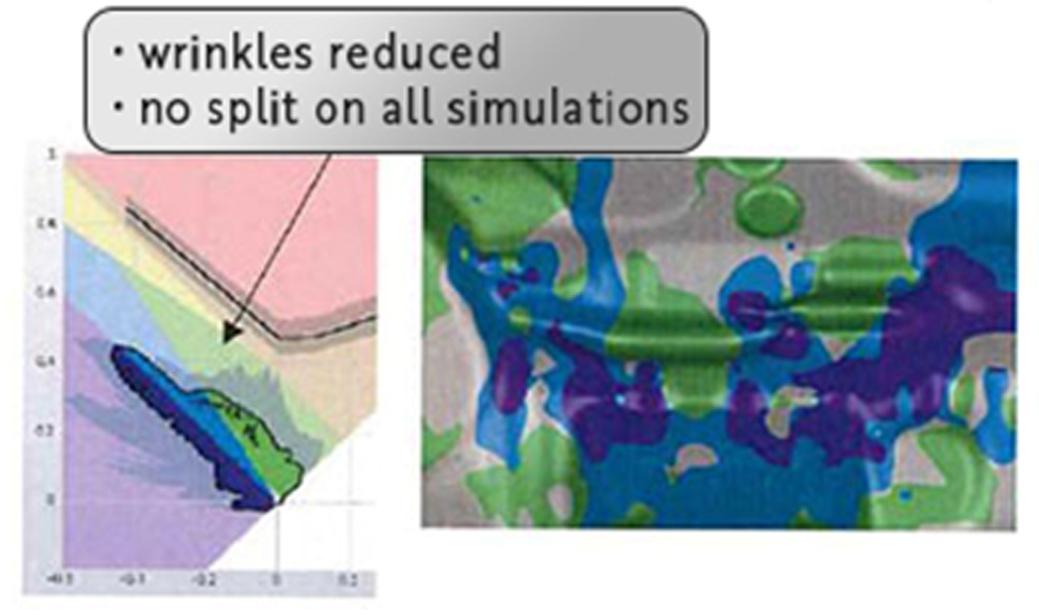
Fig. 4: Forming limit diagram for the forming defects
Conclusion
After undertaking this project, the customer recognized how important it is to study the influence of variable process conditions in the SE and final validation phases. The customer also reduced the computation time to run robustness studies by upgrading their Sigma solver capabilities to run as many simulations in parallel as they have processors. The performance with this model has proven to be three times faster, and the studies are therefore completed in much shorter time.
If the customer had used robustness analysis in the engineering phase to predict sporadic defects during mass production and taken appropriate countermeasures, they could have saved some ten-millions of yen — including the cost of defects, press downtime, re-making the draw die, and modifying the tools in the later processes. Considering the number of parts the customer annually produces, these savings add up to a significant impact. As a result, introducing this solution has helped the customer effectively deal with the issues they faced during mass production.
Thanks to this study, the customer decided to adopt the robust manufacturing process approach for all projects involving formability and dimensional accuracy. They expect their corporate value to increase, and their relationships with business partners to be strengthened.


?")


