
Numerical simulation of sheet metal forming processes has become an indispensable industry tool. Although the complexity of the frictional behavior is identified as a key factor for prediction accuracy, the industry commonly applies a constant friction coefficient for the whole tool. Furthermore, the influence of the tool’s roughness distribution on the frictional behavior has not yet been addressed. In a recent study, Mondragon University evaluated the influence of the die’s local roughness on an advanced friction model, suggesting TriboZone as a newly implemented model for advanced or mature process verifications.
The study’s main objective was to evaluate the potential impact of the local tool roughness in an industrial automotive deep drawing numerical simulation. The aim was to establish whether considering the influence of local die roughness would be worthwhile in future investigations.
To obtain a representative quantity of data, Mondragon University conducted roughness measurements across over 25 different industrial tools (more than 190 measured points). Each tool was divided into three different effective areas, depending on its geometry, features, and localization (Fig. 1).
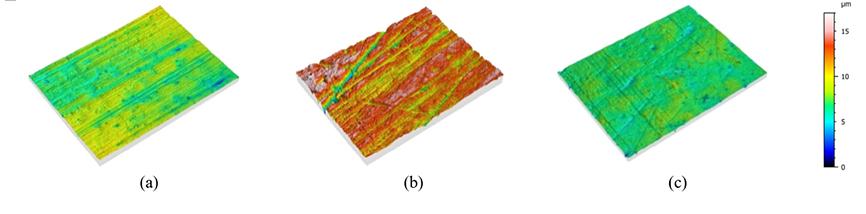
Fig. 1. Measurements corresponding to the areas of the tooling: (a) outer flat area, (b) inner flat area, and (c) radius area
From the analyzed representative surface areas, the surface properties were described in terms of average surface roughness (Sa), linear roughness (Ra), and Sz/Rz which is the maximum peak to valley distance of the surface. The measurements were used to generate TriboForm friction models with TriboForm Analyzer® software by defining the corresponding tool surface roughness (Fig. 2).
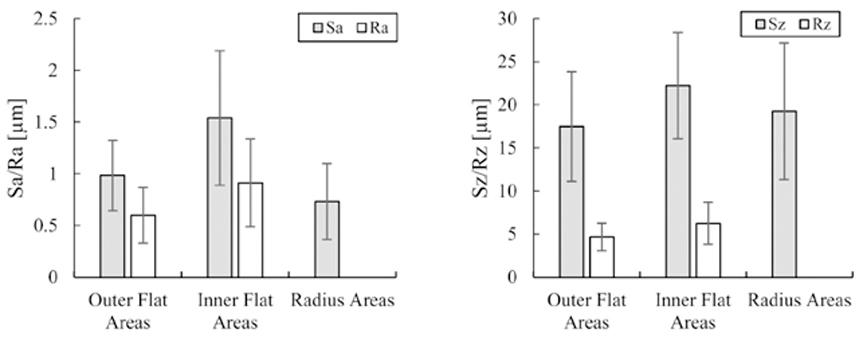
Fig. 2. Measured average roughness (Sa/Ra) and maximum height (Sz/Rz) of the three studied areas
To showcase the potential impact, the formability behavior was compared across three deep drawn parts, while four different friction models were assigned (Table 1). As shown in Fig. 3, all benchmark tool designs were modelled with draw-beads. Accordingly, the material flow was restrained by both the draw-bead and the friction on the blank-holding area. This controlled the drawing operation and the robustness.
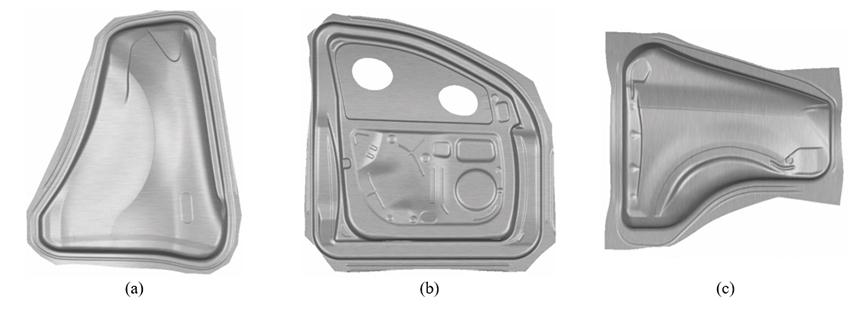
Fig. 3. Selected industry benchmark: a) aluminum fender, b) steel door inner and c) steel fender
| Constant | P-dependent | TriboForm | TriboZone |
| Classic 0.15/0.12 | Pressure dependent Friction coefficient | Industrially validated TriboForm model | Local roughness dependent Enhanced TriboForm model |
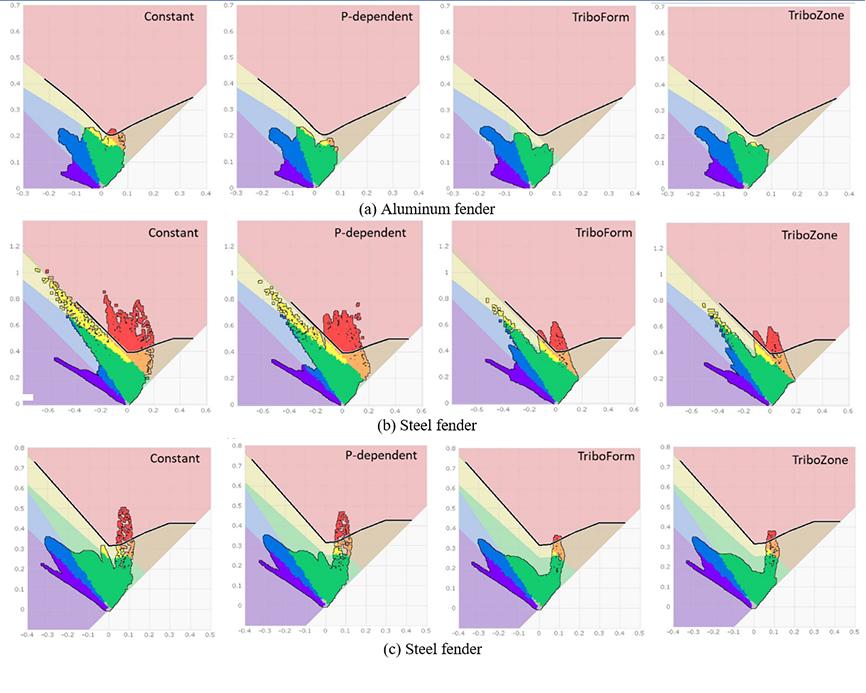
Fig. 4. FLD diagrams of the benchmark parts in which the FLC and the strain points are represented in four friction models
Fig. 4 shows the impact of the friction models on the formability behavior. The general trend observed in this investigation showed that the constant friction model predicted higher restriction compared to the other three models. A slight reduction in restriction was observed when assuming the P-dependent model. However, greater differences occurred when using the TriboForm and TriboZone models; both predicted less restriction, which in two cases resulted in a critical part. In view of these results and the cost efficiency of implementing all four models, the TriboForm friction model is recommended for conducting feasibility studies. Local roughness has been shown to have a moderate impact, so implementing the local roughness may be of interest at mature process optimization stages (validation). The next steps will involve further investigations to compare the impact of the present findings with industrial experimental data.
Readers can access the original study from Numerical study of advanced friction modelling for sheet metal forming: influence of the die local roughness (https://doi.org/10.1016/j.triboint.2021.107259 ). This work was led by Dr. Joseba Mendiguren, Dr. Alaitz Zabala and Mr. Daniel Cañizares from Mondragon University and AutoForm, respectively.


?")


