
The Path of Least Resistance Starts with Geometrical Design
In this post, an anonymous Japanese customer shares their case study targeting an issue with springback. As an alternative to struggling with the current shape for reinforcement parts, the company believes tryout loops can be avoided by modifying the part to suit the material itself. The purpose of this process is to find the optimal geometry requiring the least amount of springback compensation. See how they determined an alternative design for a roof reinforcement part using this strategy.
Using simulation to reduce springback for AHSS
It’s common practice when compensating roof assemblies to reduce the curvature of the reinforcement part to less than the curvature of the roof. However, this convention comes with inherent drawbacks, such as insufficient stamping pressure and limits on the amount of compensation achievable for AHSS materials. These engineering challenges pose a liability to both time and quality. To avoid this, in the product shape’s evaluation stage, the company considered an alternative shape requiring the least amount of compensation.
They tested a roof reinforcement component to verify the ideal shape of least springback magnitude using the high strength material SPCN 118YL-N, with a thickness of 1.2 mm.
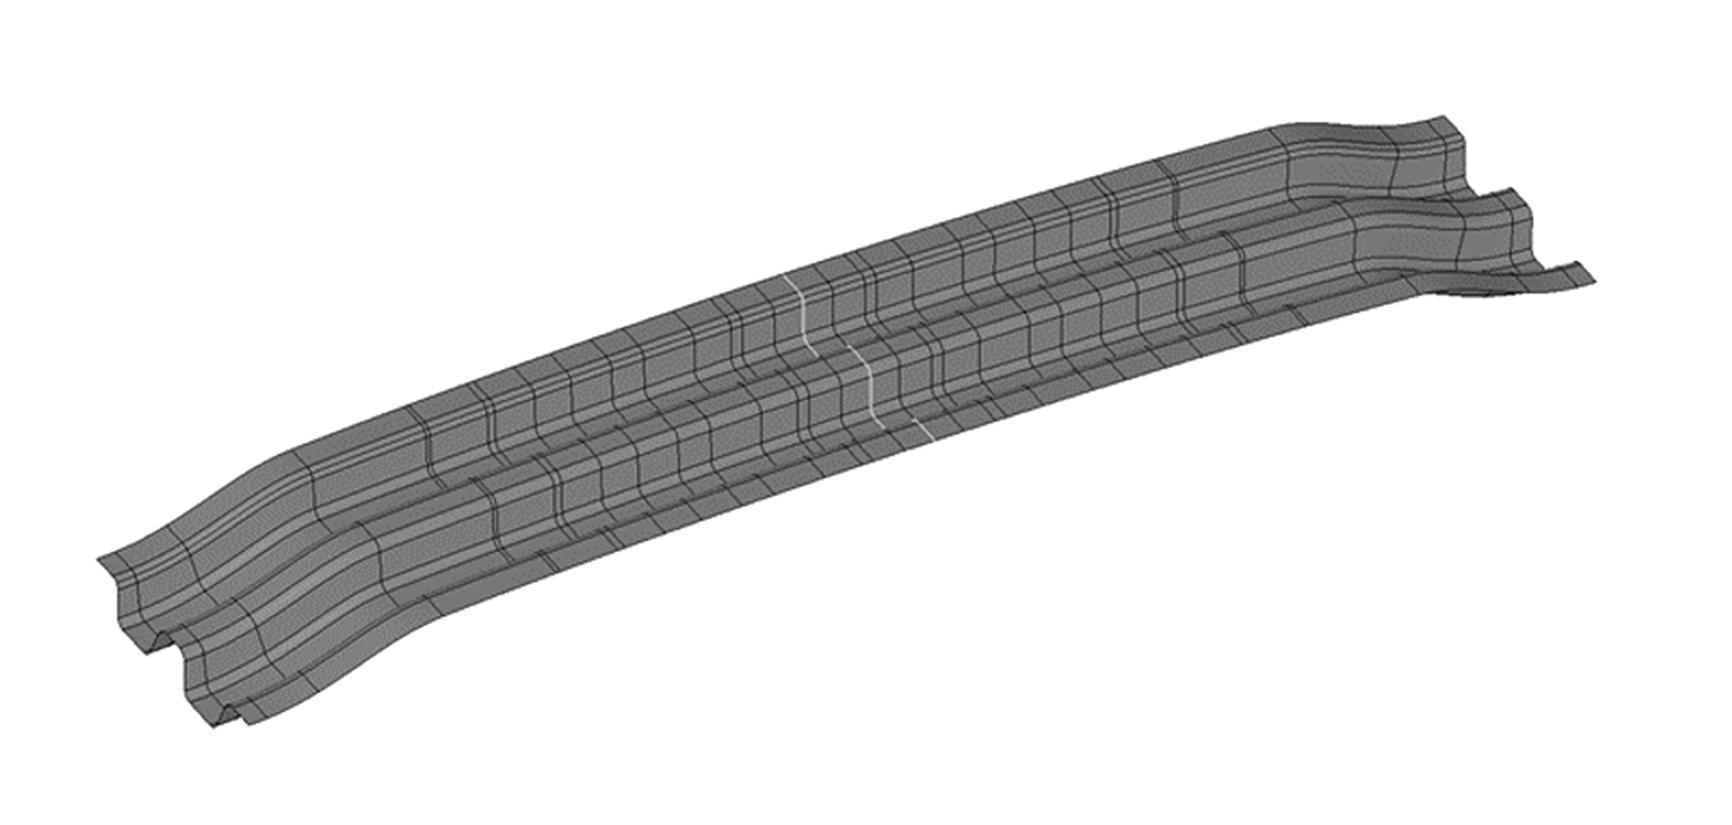
Fig. 1: Roof reinforcement development model
To carry out the verification, all holes, seat surfaces, and trim lines that depend on the vehicle’s unique shape were removed. The company created a model for springback verification based on the longitudinal cross-section in the center of the product to identify the best shape for springback reduction. In addition, they applied an alternative brand’s simulation software on the same project to compare the differences between the results and those obtained through AutoForm.
Isolating the Shape Affected by Stress Relief
The company calculated the springback reference value (starting point) by simulating the stamping process using the current roof reinforcement shape.
Calculation confirmed that a maximum of 15.8 mm of springback occurred at the material’s edge (Figure 2).
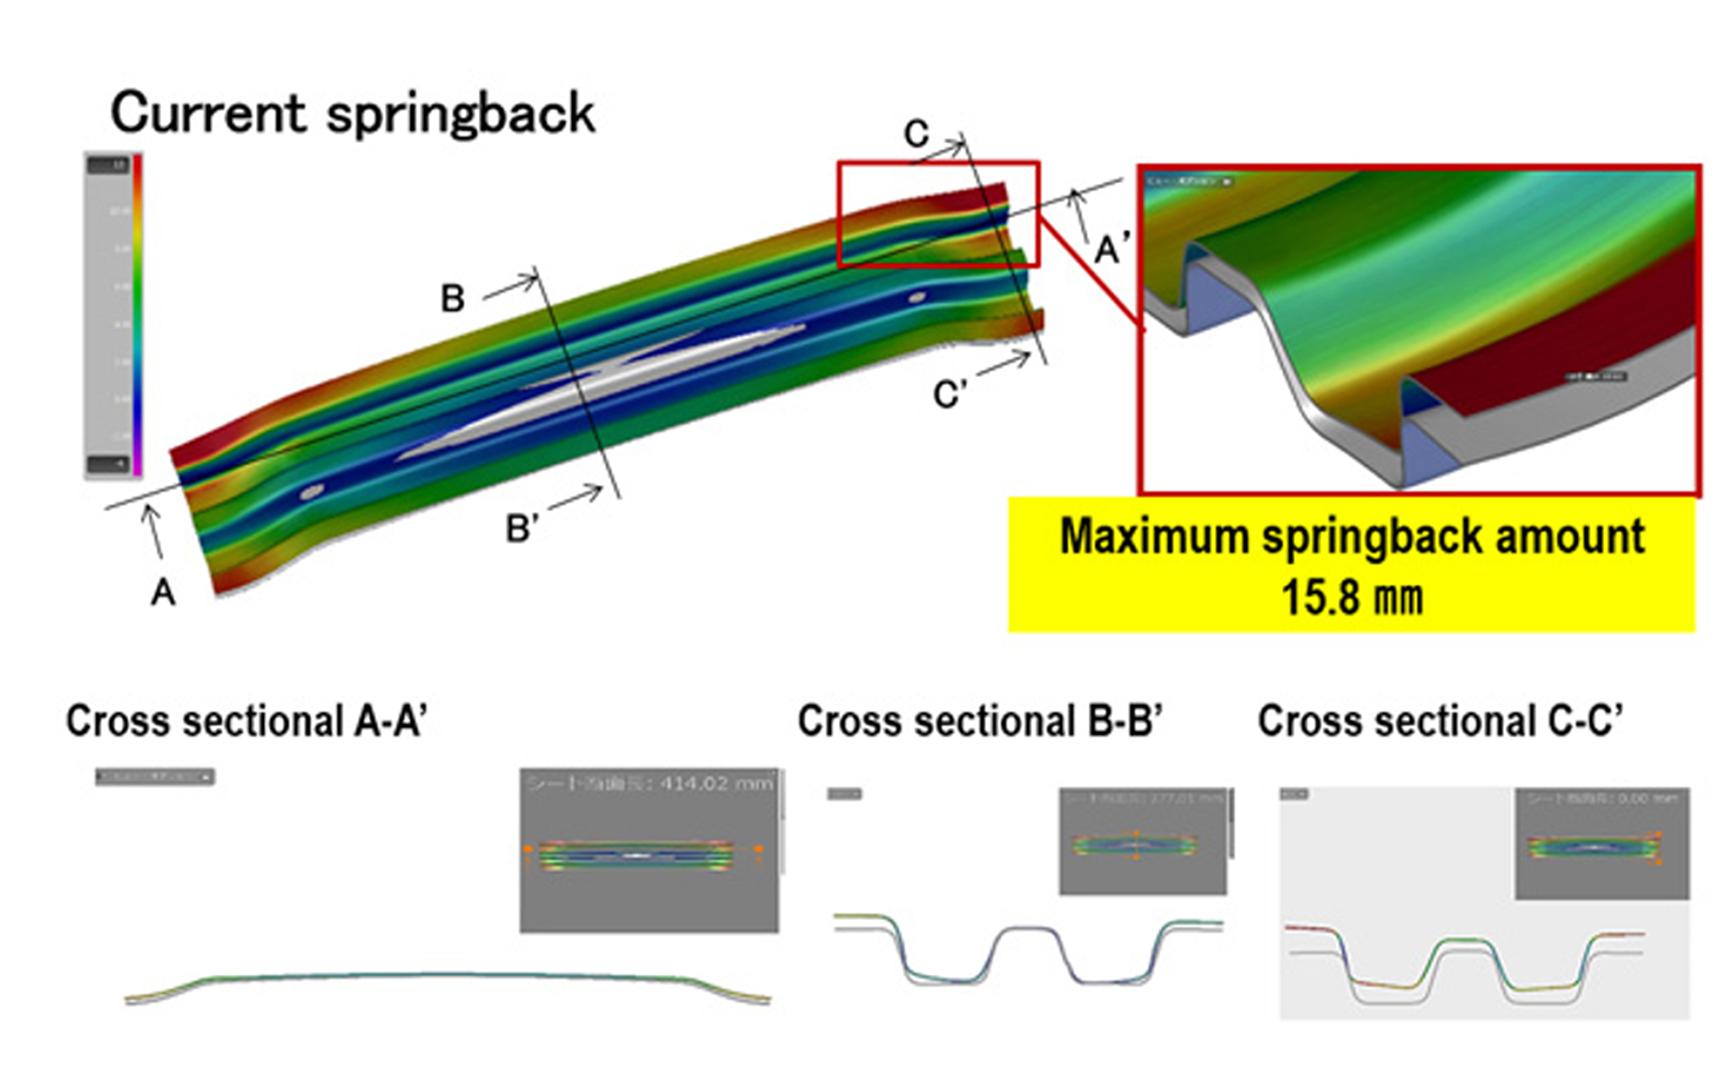
Fig. 2: Springback analysis
The stress distribution affecting springback was determined based on the simulation results of the original product shape.
They subdivided the part into three areas with the purpose of understanding what happened when the stress in each area was relieved. In reference to Figure 3 below, the three locations were defined: (a) the edge of the product, (b) where the wrinkles occurred, and (c) the center of the product.
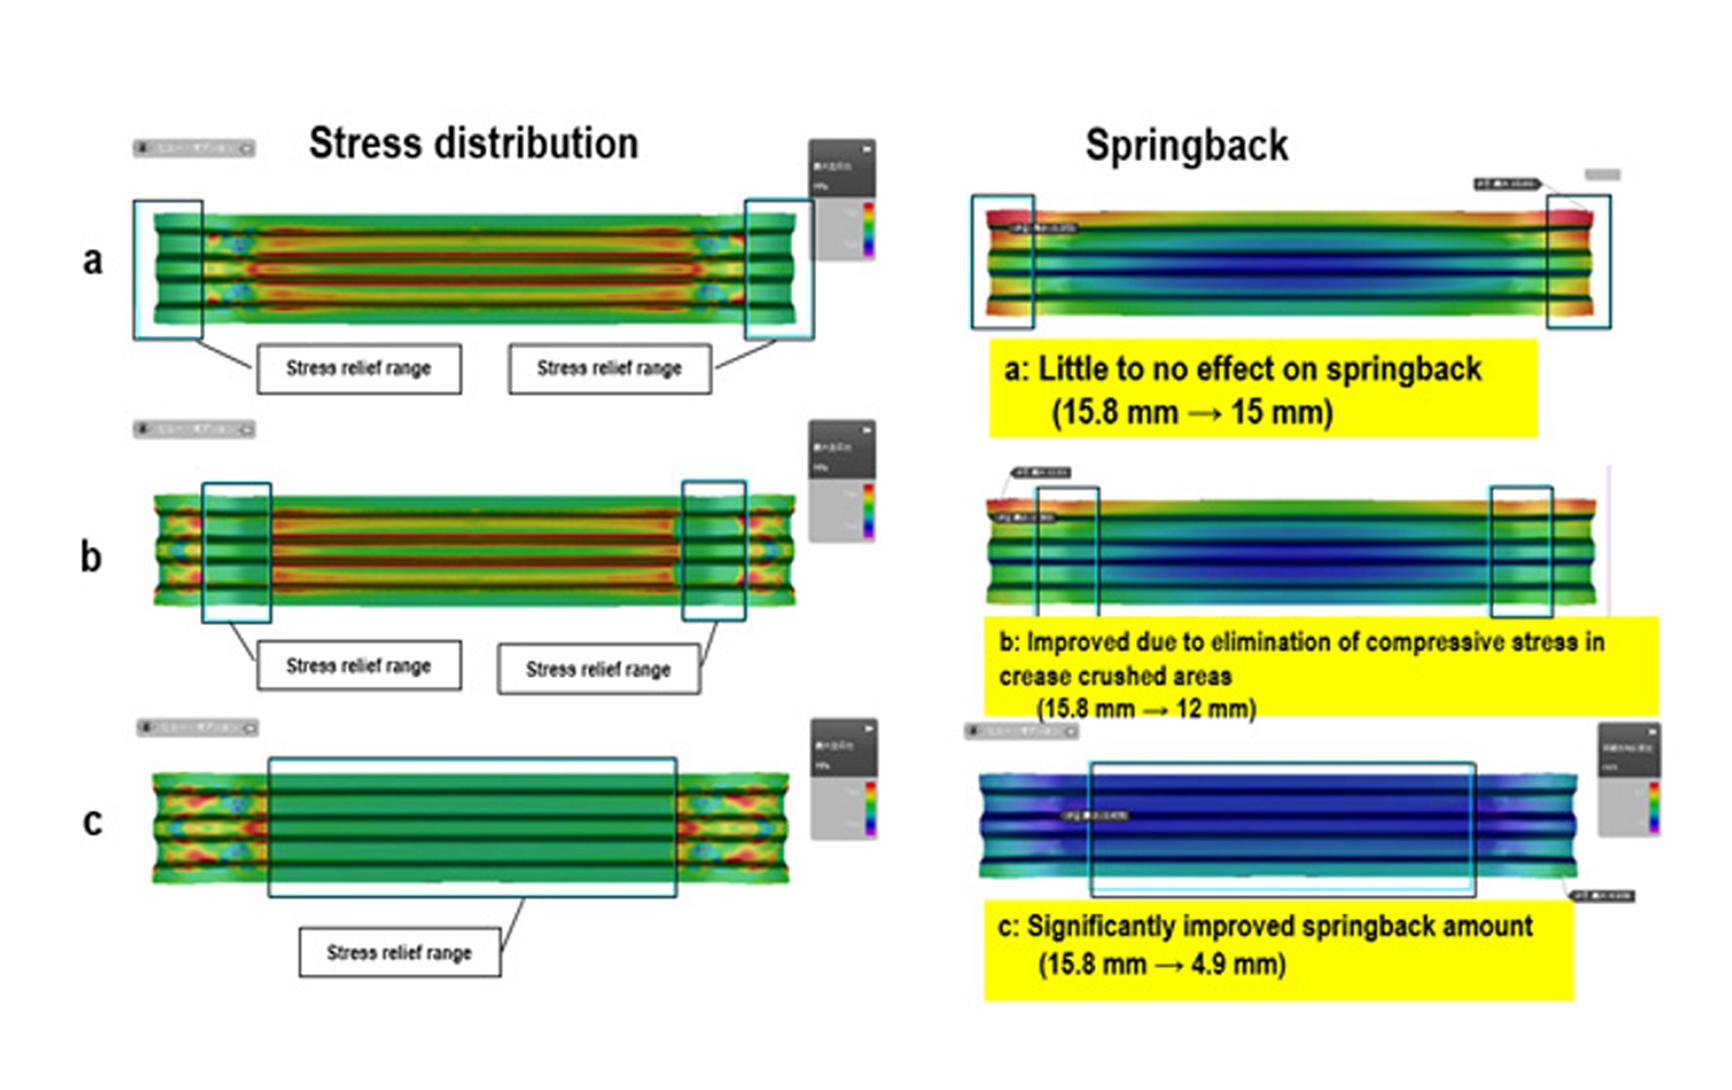
Fig. 3: Isolating the profile affecting springback
The stress was partially removed from these three locations and an impact analysis was conducted to determine the resulting change in springback. From the above results, the company discovered that stresses located in the center of the product (location c) had a major effect on springback: by releasing the associated stress, the max springback dropped to 4.9 mm (from the initial 15.8mm).
After identifying the area with the greatest impact on springback, it was time to decide which feature or countermeasure to adopt and where to apply it in order to release the stress.
They identified three positions: along the cross-section: the “vertical wall”, the “upper surface”, and the “lower surface”. Subsequently, it became obvious that the lower surface had a significant impact on springback.
So, two options were considered for improvement: (1) eliminating wrinkle stamping or (2) adding a shape that constrains the backing to the inner springback of the product. First, to eliminate wrinkle stamping, the company deepened the shape of the product in the area where wrinkles occurred and increased the actual length of the cross-section. As a result, the amount of springback improved from 15.8 mm to 11 mm.

Fig. 4: Countermeasures
Through a robustness analysis, a new proposed roof reinforcement shape was created and after analyzing the springback amount, this resulted in an improvement from 15.8 mm to 6.6 mm at the base. However, the addition of the bead shape created a new problem of approximately 140 tons of additional processing pressure during stamping (Figure 5).
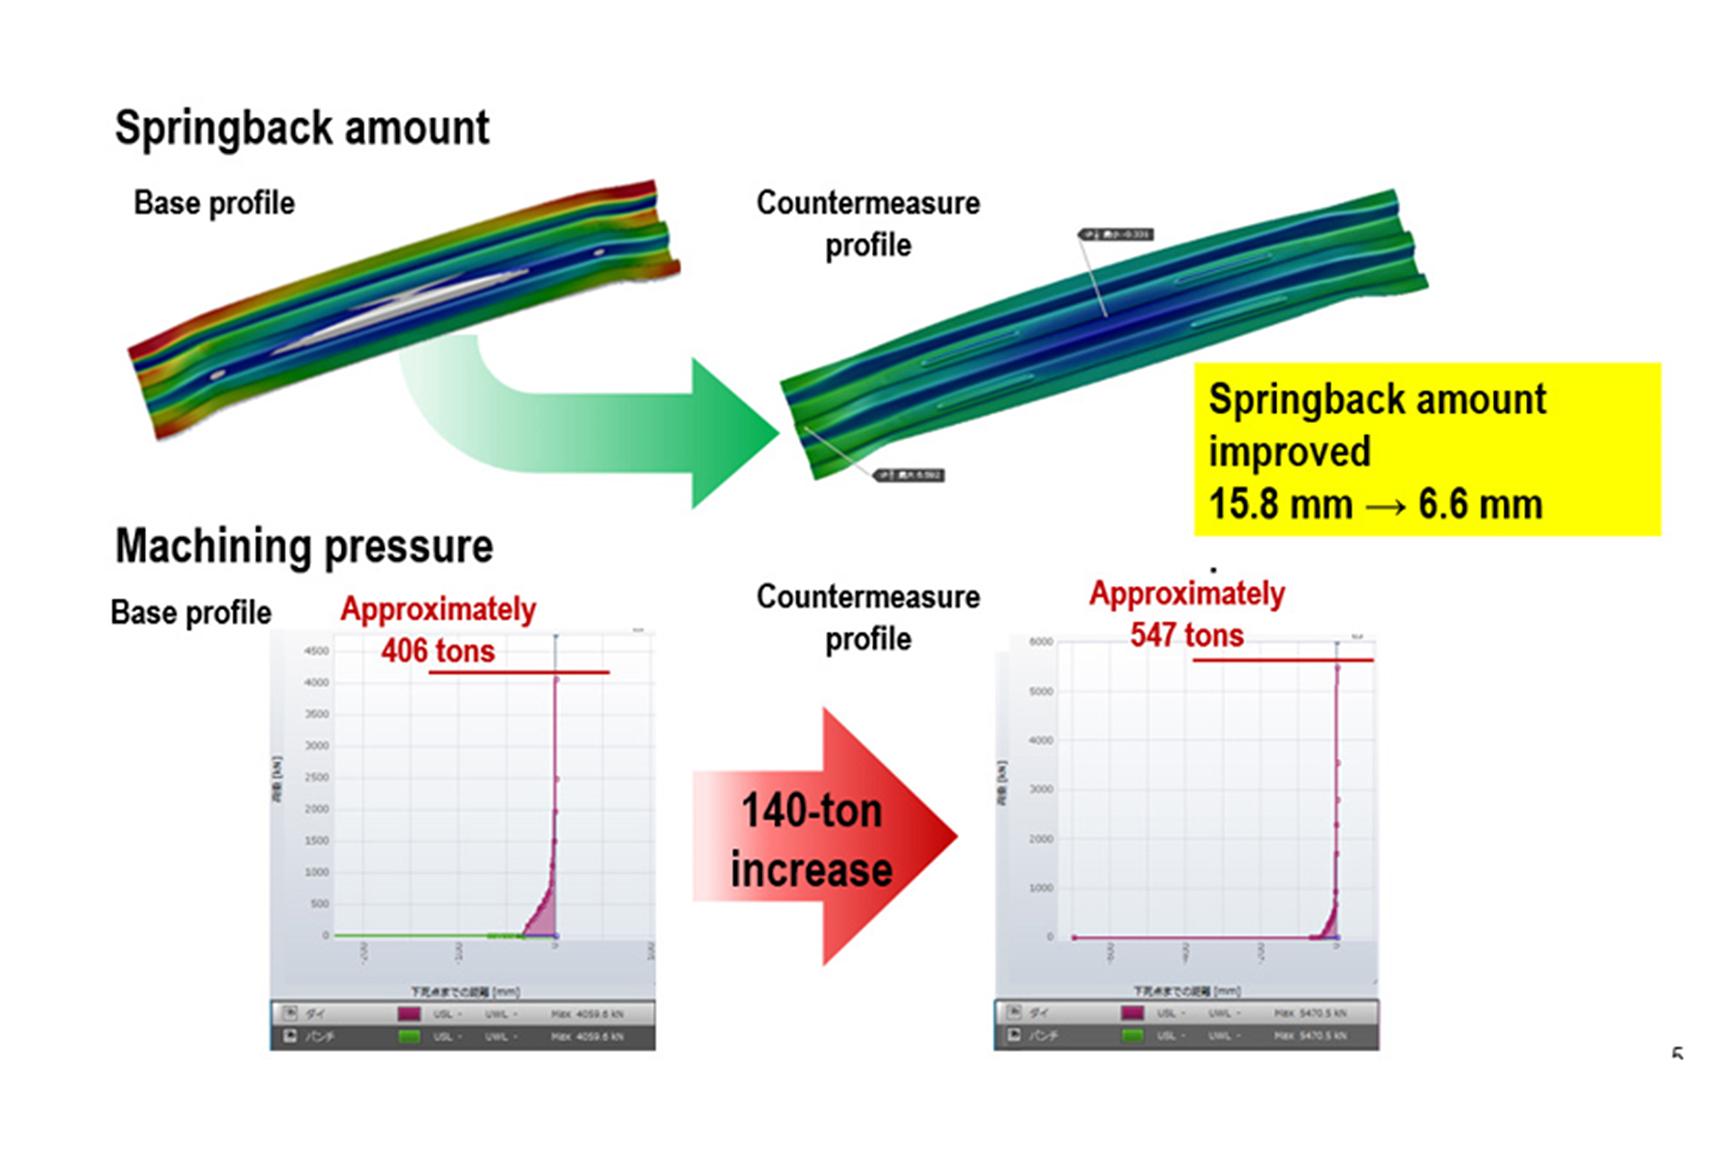
Fig. 5: Stamping pressure comparison
When considering the function and the pattern for assembly, significant processing pressure was required, which wasn’t practical considering the pressure limits of the press machine. Therefore, to minimize the increase in stamping pressure, the company proposed the creation of a round seating surface instead of adding a bead shape.
By using AutoForm-Sigma simulations to determine the best seating surface position, it became possible to reduce the stamping pressure by approximately 100 tons while maintaining the same amount of springback at the same level as the proposed bead. As a result, only a 40-ton increase in stamping pressure over the existing base profile with a maximum springback of 5.1 mm was achieved (Figure 7).
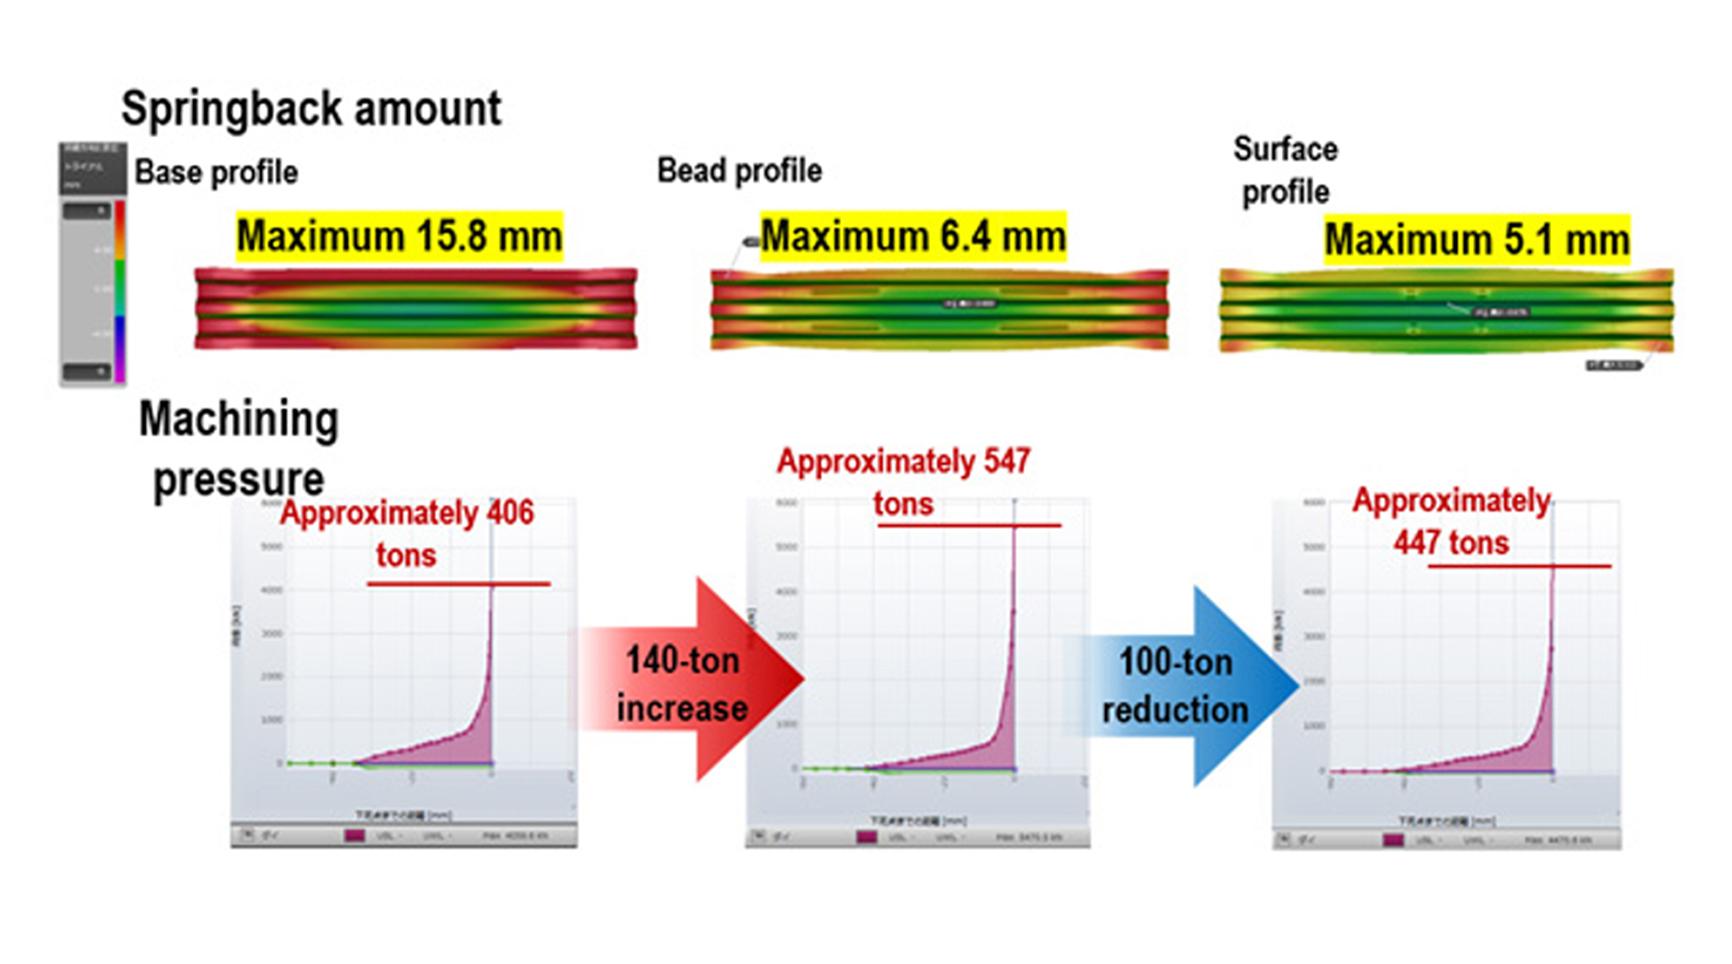
Fig. 7: Stamping pressure reduced by 100 tons
Based on these results, the company identified that springback could be controlled by adding a round seating surface to the bottom of the product in the simulated roof reinforcement model. As a result of using AutoForm, the time required to calculate the optimal seat position was reduced from 7.5 hours using the conventional method of CAD in combination with their in-house analysis software to 1.8 hours. Thus, with a 76% reduction of man-hours, the team’s resources and analysts could be allocated to more important tasks.


?")


