Forming Limits and Splits: Reading into Sheet Metal Behavior
The use of simulations is presently growing in manufacturing companies in today’s world, and the specific segment of stamping is no exception. In this article Adilson Calmona, Junior Application Engineer from AutoForm Brazil, takes us deeper by emphasizing the importance of post-processing in the simulation of sheet metal forming processes. In order to cover all existing kinds of analyses available, we’ll release further articles in the future
In our industry there isn’t any single “one size fits all” procedure to perform post-processing analysis. Each company has its preferred software and its own manner of approving a simulation. What I present here are some tools and strategies which serve to bring greater understanding regarding this type of analysis. Let’s look deeper.
In order to allow an adequate analysis of forming simulations results, CAE software include many functions used to help identify possible problems such as splits, wrinkles, draw-in, sheet surface defects, springback, skid lines, etc. This first blog post will be restricted to the subject of splits evaluation, providing a better understanding of the tools used in simulation for the identification of this basic type of forming problem.
For the splits analysis the most frequently used tool is the FLD graphic (Forming Limit Diagram). FLD is a diagram that arises from the stretch state of the sheet. Below is a typical FLD curve for steel:

Figure 1 – Forming Limit Diagram
The black curve represents the combinations of the strain states of specimens that show signs of rupture. The region above this curve is interpreted as the failure region, while the region below the curve can be divided into several areas representing different levels of stretching of the sheet.
Measurements are made through circular markings on each test specimen, which after the forming become ellipses allowing the determination of the stretch in two directions. The data collected come from the largest and smallest diameters of these ellipses.

Figure 2 – Specimen with markings
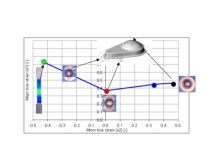
In the example below, there are different specimens that produce different deformation states. If the test specimen is formed until the onset of rupture occurs, a critical state of deformation can be determined.

Figure 3 – Examples of the Specimen Test and Curve Creation
The connection between these failures points results in the forming limit curve that defines the Forming Limit Diagram (Figure 4.) So, when the simulation has a red point the interpretation is that the region is splitting. The forming limit curve must be determined individually for each material.

Figure 4 – FLD
Due to variations in material properties within any batch of coils and measurement accuracy limits during curve determination – software used for sheet forming simulations should adopt a safety margin, generally 20% (a value that can be modified by users). This safety margin is represented by the yellow color just below the forming limit curve.

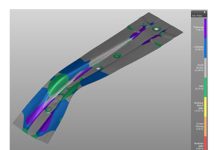
Figure 5 – Simulation Result
Still within the region of rupture, there is another tool that can be used, known among software users as “Max Failure”. This is a mathematical criterion and its value represents how close to rupture a particular point is. Values equal to or greater than 1.0 represent the occurrence of failure at the selected point.

Figure 6 – Max Failure
For a complete description of the stretch state of the sheet we must also consider the deformation in the thickness direction, in addition to the in-plane deformations. This result variable, determined by a mathematical calculation that takes into account the incompressibility of the material, is known as “Thinning”. Hence, this result variable indicates the change in sheet thickness during the forming process.
Excessive thinning (whose limit value is generally defined by product engineering) is indicated in the Forming Limit Diagram from stretch states that produce the same thickness, described by a straight line tilted at 45° to the left. This region is usually represented by the orange color.

Figure 7: – Left: Deformation in thickness direction.
Fig. 8: Excess thinning region

Figure 9 – Thininng
The blue region in the FLD diagram represents the stretching states where a shift of the main tensile strain from tension to compression occurred. This area may suffer surface defects or show the appearance of wrinkles.
Another factor represented in the FLD diagram is that of thickening. The appearance of wrinkles can occur due to several distinct reasons that include a lack of desired stretching of the sheet and very large compression where there is no increase in the thickness of the material. These eventually create wrinkles on the sheet. In the FLD diagram this is shown by the purple color.

Figure 10 – Wrinkles
Still concerning splits analysis, many users need to evaluate possible edge cracks generated by the plastic deformation of the sheet edge after cutting. These edge cracks arise directly from the state of uniaxial deformation developping at the sheet edge during deformation. An irregular cut leads to cracking due to the pure shear effect, which is the critical deformation to be considered in the uniaxial state of tension, somewhat earlier than indicated by the FLD diagram.
An additional postprocessing tool known as “Edge Cracks” assists in the analysis of this kind of cracks. It allows for the evaluation of cracks influenced by three types of cutting conditions: laser trim, cutting tools with sharp edges and cutting tools with worn edges. To determine the correction factors for these three cut conditions the lowest point of the FLC curve, called FLD, should be multiplied by the following factors, depending on the cut type:

Figure 11 – Edge Cracks
A different type of crack, namely so-called “Surface Cracks” may be analyzed using another tool. It assists in the analysis of folded sheet rupture at very small bending radii. This is because if the ratio of the bending radius to the thickness of the sheet becomes too small the tendency of the sheet to develop surface cracks due to excessive surface stresses increases.
The ratio between the bending radius and sheet thickness is known as the Bending Ratio, given by the following equation:

Figure 12 – Bending Ratio
In order to evaluate the tendency of this type of crack, the user must define the Minimum Bending Ratio in the material file. After entering this data and with the “Surface Cracks” feature activated, the simulation indicates the critical points with respect to this criterion. It can be seen in the image below with the help of the color chart that the red region shows failure due to Surface Cracks.

Left: Fig.13 – Min Bending Ratio. Right: Fig.14 – Surface Cracks
It has been noted in our market that companies are increasingly looking for solutions that help prevent problems long before starting part production, and with simulations and such post-processing analysis it is easier to find these problems and, through such engineering evaluation, solve them before they even appear in production leading to a far shorter tryout.
Adilson Calmona Dutra –member of the AutoForm technical team in Brazil, Mechanical Engineering graduate from Mauá Institute of Technology (IMT – Brazil),. adilson.calmona@autoform.com.br
New readers don’t forget to sign up to our blog! We’ll never send you any marketing emails. You’ll get a once per month update on our latest top post!


