
Robustness as an Indispensable Element of Securing Simulation Accuracy
This is part five of our series on using the AutoForm Pareto Principle to improve simulation accuracy. In this post, we demonstrate how to strengthen our forming simulation by including robustness analysis as a key factor to expand the overall Accuracy Footprint.
Series Index: Part 1, Part 2, Part 3, Part 4, Part 5, Part 6
Having already covered the essential parameters, the crucial parameters, and the important parameters in our previous posts, we now have a solid representation of the real engineering process through the simulation, since these parameter groups account for 95% of the overall accuracy of the final simulation results. We will not yet approach the final level of detailed parameters (see next post) until first securing robustness in the overall process setup we have already established.
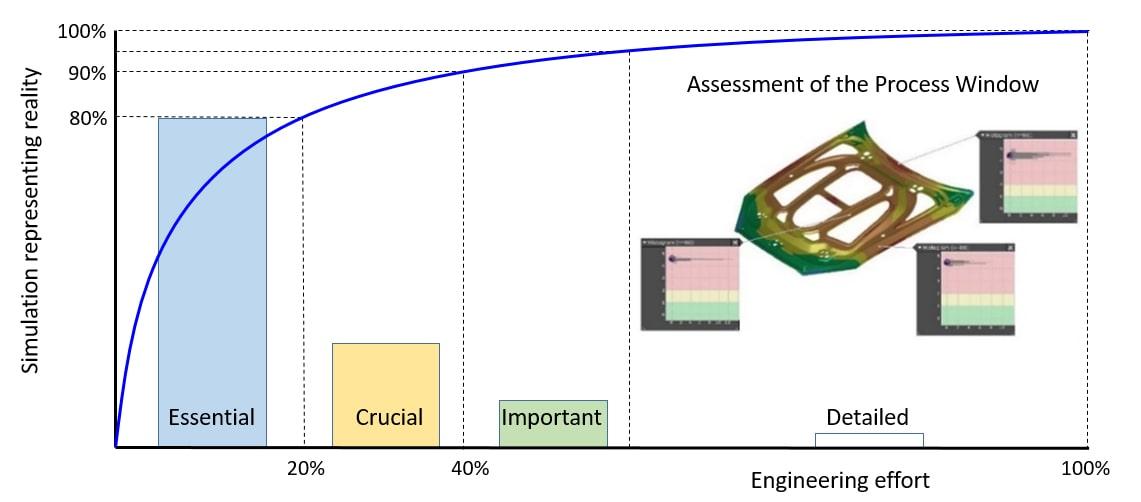
Fig. 1: Simulation input parameters and their impact on simulation results
The important parameters build upon the essential and crucial parameters. For example, if you change a crucial parameter, you have to fine-tune the important parameters all over again. The subsequent detailed parameters are not yet of consequence because they bear minimal influence on achieving a robust result.
One of the biggest challenges of the initial tool tryout is ensuring the first stamped panels meet the dimensional tolerances using the checking fixture. So far, we’ve been spotting the dies and working on making the dies functional. At this point, we can collect the data and run a batch of blanks to verify the process capability, process sensitivity or process precision. These are different terms used to express how well a series of parts meet the required tolerance. Typically, more than 30 parts are stamped, sometimes even up to 300 parts, to verify the process precision.
If these parts are not all in tolerance, process capability is not guaranteed. Our process window is unknown and apparently small and we have parts violating tolerance. This is where the money begins to fly out the window and the next steps become tricky. If you were to gather a panel of tryout experts, they might tell you – based on their experience – to continue with spotting and nesting the dies. Yet, this becomes a time-consuming and costly activity; plus,its hard to identify what may be causing such poor process repeatability. Working on the dies is undoubtedly the hard way to solve this problem. In fact, in the worst cases, there is no solution to achieve repeatability and you may be chasing a phantom until time, money or advice runs out.
Stamping simulation is all about representing the real process. Only when this is assured, simulation results will help to avoid costly trial and error. So to avoid a guessing game during tryout, this first batch of blanks should be simulated and the process precision evaluated during engineering – before the die is milled and built. By performing this robustness analysis, we can create a set of data points representing the precision (or capability) of the real-life process. As a result, the robustness analysis provides very valuable information to support the engineering decision-making process.
A Closer Look at Robustness Analysis
If the base of a robustness analysis is the nominal simulation, we must define a set of variable input parameters. In practice during well-defined mass production processes, variations are generally quite small at ±10%. Parameter values around the nominal value are most common; the further you get from this point, the lower the probability that such a parameter value will occur. The variations of parameters such as thickness, yield stress correlated with tensile strength, R-values, lubrication amount, binder force, and blank position are all considered in the analysis. These parameters vary within tolerances in reality, so we could reasonably call them uncontrollable parameters. They are only controllable within a certain range, which is defined by the tolerances, meaning they never have an exact “true” value.
With a variation of the input, you can therefore expect a variation of the output — and of course, the analysis results will also vary. During the result evaluation, we verify whether the variation of the result values violates the specified limits. This result variable is called the process capability index(CPK). Here, we apply the same criteria in the simulation as we did in the tryout or production phase. As such, we use identical statistical process control measures engineering as in production and quality assurance.
If result variations do not violate the specification limits, the process is called robust. Practically, this means that the process will generate acceptable parts no matter how the input parameters vary (within the assumed variation ranges). Mathematically, it means that the process capability index, or CPK value, is larger than 1.33. When the result variation violates the specification limit, the process is called non-robust.
Today, many companies around the world have adopted this robustness analysis in their engineering processes to avoid costly trial-and-error activities in either tryout or production. We encourage its application,as only a robustness analysis will give you a quantified prediction of the part production process capability. And, in the end, the stability and output of the production process is the most relevant goal of engineering for mass production processes. There is no substitute for a robustness analysis to predict and avoid production issues and failures.
OEM Inner Door Splits Example in Brazil
With this in mind, a robustness standard was applied to the base simulation. Now, engineers were able to compare newly identified critical points indicated by the AutoForm team’s robustness analysis. The engineers compared these results with their production statistics — the critical regions revealed by the robustness analysis showed a very good match with what they observed in practice. Simply put, if we could identify the errors and find the source of the problem, then we could also solve the problem.
For our customer, this confirmed the accuracy of AutoForm’s robustness evaluation, providing their team of engineers with useful information to find the best solution for the current production problems. Since the problem was solved, the engineers have reported that previously problematic parts are now stamped smoothly with no rejection. The importance of viewing the entire process window rather than just observing a single process point is thus clear.
The Jim Yung Precision Case in Korea
Jim Yung Precision had successfully completed its engineering phase, yet during the initial tool trials, cracks occurred in three different locations. Even though single simulation results could not identify critical areas, a robustness analysis taking into account unintended variations of process conditions in real production revealed that the CPK value (process capability) was poor at exactly those same points. Impressed by those results, Jim Yung began increasingly usingAutoForm-Sigma to conduct robustness analyses over several months to reduce the number of tryout loops and gain significant cost savings with every tryout successfully completed without issues.
Volvo Trucks Sees Three Years Without Splits
Volvo Trucks consulted with AutoForm with the aim of achieving digital improvements for stamping robustness. The existing process robustness within tool supplier contracts was limited to a simple assessment of the process capability over a short period of time. As only a small quantity of parts is manufactured during the first phases of production,this did not allow for the validation of the quality produced over a full range of material tolerances. During the investigation, the first target phase was aimed at identifying a process window that would allow for greater production process capability throughout the part’s lifespan.
For three years now, the AutoForm-Sigma robustness analysis has been one of the main drivers leading to a 5% increase in instamping productivity for Volvo Trucks, while down times related to tooling issues have dropped from 2.5% to 1.5%. A design of experiments is currently being carried out using the software. Without the software, at least five years of production would be necessary to obtain the same statistical feedback through experimentation.
All these cases demonstrate that relying on a single process point in engineering isn’t enough to guarantee successful tryout, production runs, and mass-produced parts. Validation of process robustness is an indispensable element of effective engineering, which is one of the important parameters that must be taken into account in order to achieve ultimate accuracy in your stamping simulations.
See part six for the final installment of the Pareto Principle series where we examine tribology and contact pressure as the two remaining parameters to complete our simulation accuracy footprint.


?")


