
The Next Phase in Growing Your Accuracy Footprint
This is part three of our series on using the AutoForm Pareto Principle to improve simulation accuracy. In this post, we explain how to set up a forming simulation based on the AutoForm Accuracy Footprint concept and examine the crucial process parameters — the second group of parameters covered in AutoForm’s Pareto Principle model. Our application of the Pareto Principle to simulation delivers a working approach, which determines which groups of parameters are more or less significant to the accuracy of the final result. In applying this understanding of priorities, we systematically and consistently evolve our simulation towards increased accuracy as more and more details are decided in the development and engineering process.
Series Index: Part 1, Part 2, Part 3, Part 4, Part 5, Part 6
As already demonstrated in parts one and two of this series, the essential parameters account for around 80% of the overall accuracy of the final simulation results. Having already secured the essential parameters in our last post, we have a solid base for the simulation to now focus on the next level of crucial parameters— and in doing so, look at things more precisely.
The crucial parameters are generally defined through company standards, and we need to take into account the standards in tool design as well since we want to represent reality. Some parameters are clearly defined. For example, whether the scaling of a draw-die should be applied is determined by the standard, as is the specific material, including sheet roughness, along with several other parameters. Others need to be fine-tuned in simulation to define an optimal value. However, such fine-tuning should be done according to a given design standard; e.g., drawbead profiles, which can actually be used in the tool.
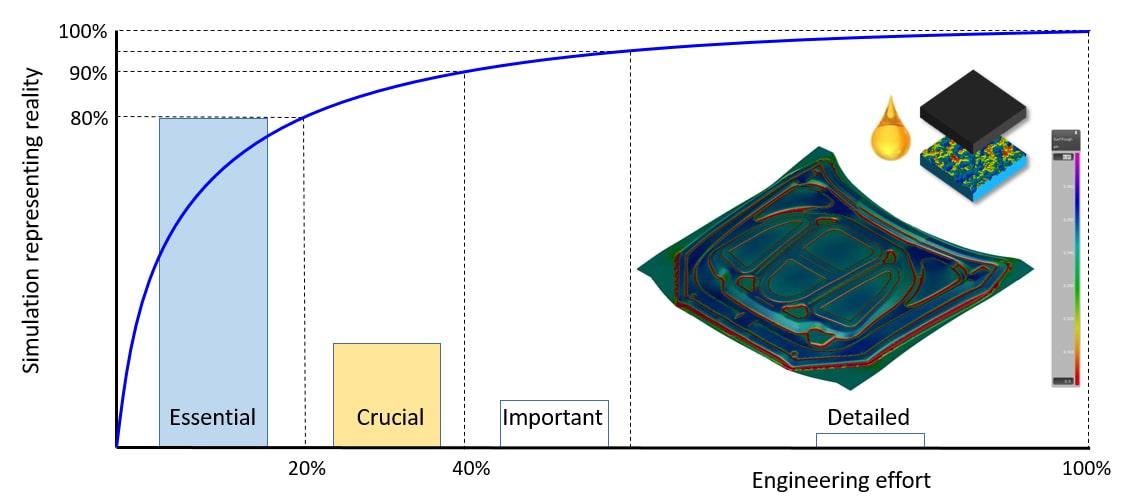
Fig. 1: Our AutoForm Pareto diagram has progressed to the crucial input phase
Here is a breakdown of the crucial parameters:
Scaling: It is common knowledge that when thin-gauge material for body panels is stretched over nominal draw geometry,it will shrink to less than the nominal part geometry after drawing. In order to offset this shrinkage effect, scaling (making tools slightly larger than nominal) is applied to the draw geometry in the physical tool. Scaling is often ignored in simulation because people tend to say, “We do this during CNC machining and it is not necessary to scale our designed tools.” However, it is often important to apply scaling in simulation since it reflects reality and can influence springback significantly! If scaling is not applied to the draw die geometry, the drawn panel will likely not fit properly onto the next operations due to shrinkage. In practice, scaling of the draw die in simulation is easy to use —in AutoForm, it is literally a single push-button solution. Often, this is defined in the company tooling standard and if it’s applied in reality, we should apply it in simulation as well.
Drawbeads: This is a crucial parameter required for designing a successful drawing operation. The drawbead location, drawbead profiles, and segments are optimized. This is one of the major fine-tuning parameters necessary to control your stamping process. The intensive usage of drawbeads in the drawing tools and the need to perform modifications requires a structured approach to modeling drawbeads in the forming simulation. A simulation model should be easy to modify and should not influence the computation time significantly. Otherwise, we would lose our engineering efficiency. Based on numerous examples, one can conclude that the results produced by various drawbead models are comparable. In general, any model can be used to engineer a successful process, proving that its behavior is well-understood and there is a clear strategy for making final process adjustments during tryout. Our general recommendation is to use an adaptive line bead model as the drawbead model, in combination with flattening and unflattening of the drawbeads.
Material model: We have already seen that the material properties form an essential parameter. Looking one level deeper, the applied material model itself is often defined in a company standard. Some companies use their own set of material data while others use data according to a given standard. However, for an effective application, one has to ensure that the material model can properly describe the quality requirements, which is why it’s important to choose the proper material file:
- The hardening curve and yield surface. The hardening curve is a representation of the stress-strain curve of a tensile test, representing the uniaxial stress state.
- The yield surface model represents the behavior in multi-axial stress states. Each model builds the unique shape of the yield surface, which is then calibrated to specific dimensions using the data from the tensile tests. Of these, Hill uses just four data points generated from a tensile test, BBC uses six, and Vegter 2017 uses ten. BBC actually requires data from bulge testing in addition to tensile, and Vegter requires additional data from compression, shear and plane strain testing. Data from such advanced tests is rarely available and this challenge is overcome in common implementations of BBC and Vegter 2017, where the missing data points are internally calculated from those available from the tensile tests.
- When exact material data is missing in the engineering phase, which is quite often the case, the material model should be approximated as closely as possible. The AutoForm material database contains close to 1000 material files, which are ready to use and have been experimentally validated by the material suppliers.
Tribology model: In a standard simulation, the friction between the tool and the sheet is assumed to be constant across the whole surface of the panel, as defined by the Coulomb friction model with one single friction coefficient. This simply is not reality; the friction actually varies across all regions of the part. At small radii, you can clearly see the effect of the relative high pressure on the frictional behavior; also, in viewing the relative sliding velocity of the material at the sharp radii, you see a decrease of the frictional behavior. In other regions, the friction is relatively high due to the low local pressure and sliding velocity.
This complex physical phenomenon can be accurately described with the advanced friction model of TriboForm. This friction model is four-dimensional, whereby the coefficient of friction is dependent on the contact pressure, sliding velocity, material strain, and temperature. Several examples demonstrating the successful application of this model have been published. The best thing about the TriboForm model is that its use incurs no penalty in simulation time, since it is a very effective friction model.
Result evaluation: No matter how advanced the simulation technology is, if users are not able to consistently enter appropriate inputs and apply reliable interpretation criteria, the interpretation of simulation results remains suspect. Forming issues can go unidentified because people did not look at the right location or failed to view a necessary output variable. Without the means to assure a consistent application of simulation parameters, design guidelines, and interpretation of results, the outcomes of metal forming simulation will still fall short of our goals. Therefore, it’s crucial to apply standards to assure that metal forming simulations are properly defined, performed, and evaluated consistently for their products and processes. It makes sense that if you’re going to all this effort, you should also take the time to look at these quality criteria, which we fulfill later on in reality, and therefore dedicate a reasonable amount of time to carefully evaluate all results.
Measurement setup: For springback to be measured, utmost care needs to be applied on how the formed sheet is positioned, or “fixtured”. Particularly prior to compensation, it is important that the holding scheme, comprised of pilots and clamps, does not distort the panel, or in any way change the natural springback response of the sheet. If springback is not measured correctly, springback evaluation will be wrong and worse yet, countermeasures and compensation will be inadequate at best and incorrect at worst. That’s why we need to carefully define and analyze the boundary conditions and follow compensation best practices whenever we consider springback in forming simulations.
Most of the crucial parameters can be defined in an early phase of the engineering process, since they should be defined in applied standards. Most of these parameters are obvious and easy to compare between simulation and reality. For example, the presence and location of drawbeads, although the exact drawbead geometry is already more difficult to ascertain. Moreover, fine-tuning of the amount of restraint for each drawbead is done during tool tryout. Other parameters are more sensitive and you should rely on applied standards such as the scaling of the draw die and tribology model, considering physical parameters regarding the sheet and tool surface roughness and the type of lubricant. Furthermore, whether a tool has been scaled isn’t very trivial to measure.
In total, all of these aforesaid values must be considered crucial parameters. They have to be taken into account with an understanding of applied standards at this stage so that these properties are not just considered input values for the process simulation software. Rather, it must be verified that they can be applied in reality as well.
In the next blog publication in this series, we cover the important parameters as the next level with validated examples of tool closing, considering tool bearing and contact conditions as well as applied process forces.
Don’t forget to sign up to our blog or return soon for another installment of this multi-part series.


?")


